What’s the path for growth going forward?
July 7, 2021
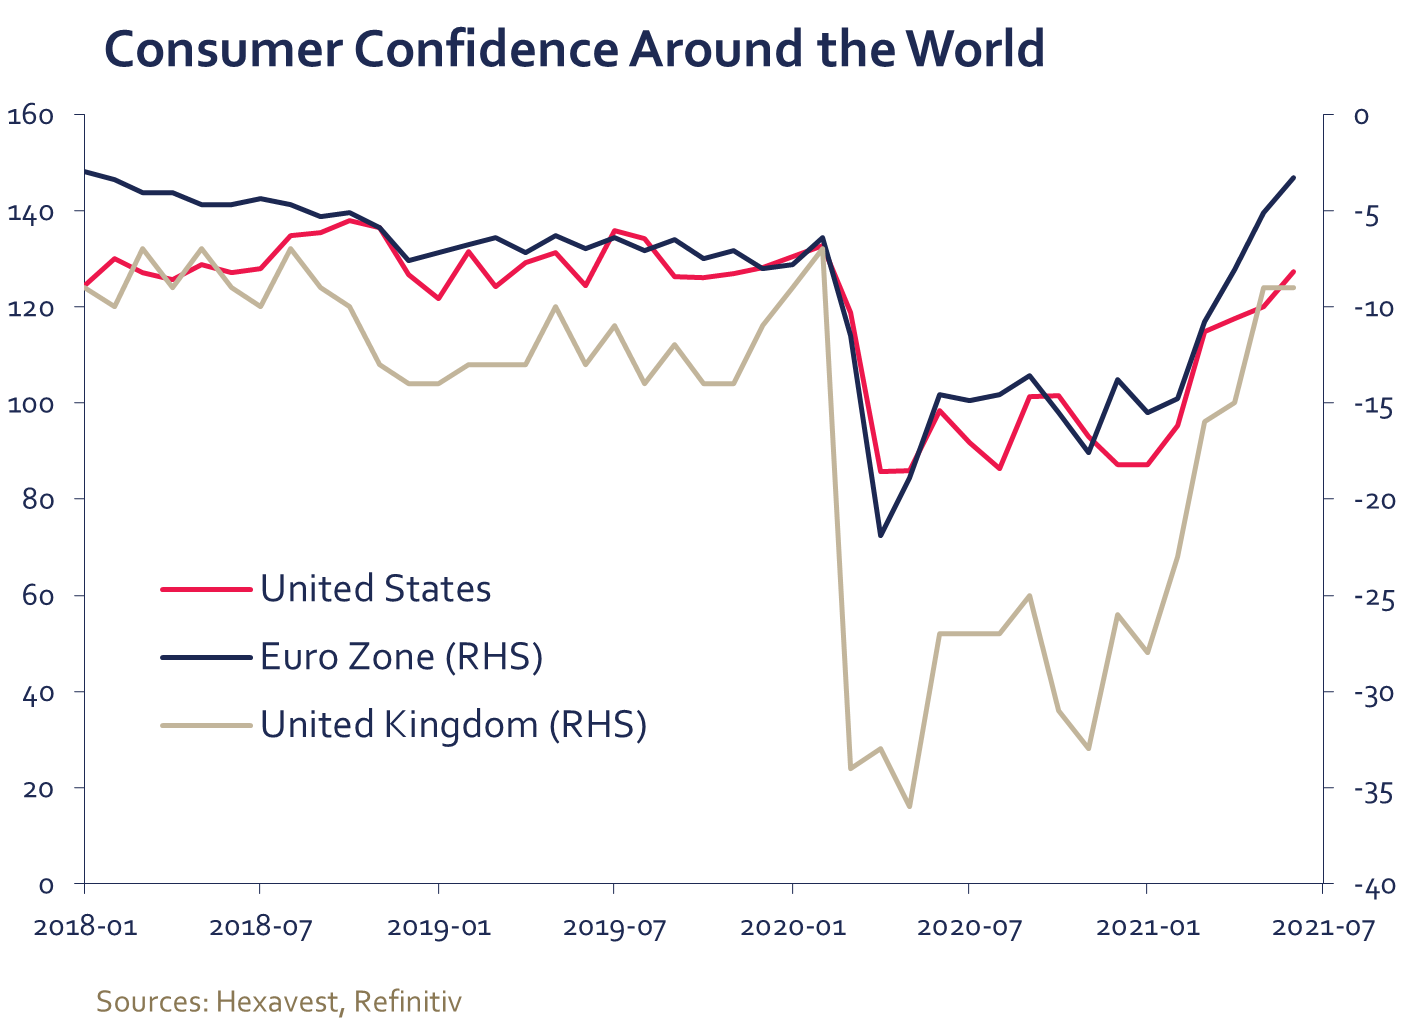
The global economy continues its healing process as it slowly returns to its pre-COVID levels. However, some indicators suggest that growth may be peaking. One recent clue was the significant miss on retail sales in the US and the UK for the month of May, with monthly declines of 1.3% and 2.1% respectively. After the large gains recorded in 2020 and early 2021, could we be seeing consumer fatigue for retail goods?
Overall consumption should remain healthy as confidence indicators suggest consumers are feeling rather good at the moment. In addition, households have built a sizeable amount of excess savings over the last few quarters and we believe that should help support consumption going forward with the service sector likely benefiting the most in the coming months.
The month of June provided a similar pattern to what we saw in May with stronger than expected inflation and a disappointing employment report. In the US, the 3.8% change in the annual core CPI was the highest since 1992, with an increase of more than 3% for the service sector. While the large rise in inflation was largely expected by investors, the lower-than-expected employment gain was not. The US economy only created 559,000 jobs while economists expected a gain of almost 700,000. Once again, the miss appears to be driven by the lack of Americans looking to get back to work; the most recent Job Openings and Labor Turnover Survey (JOLTS) shows there are more than 9.2 million job vacancies. According to Reuters1, states that ended federal benefits recorded a larger drop in unemployment insurance claims, suggesting the incentive to return to work increases as benefits are reduced. While hiring has not picked up significantly in these states, employment gains will probably improve in the coming months as benefits expire.
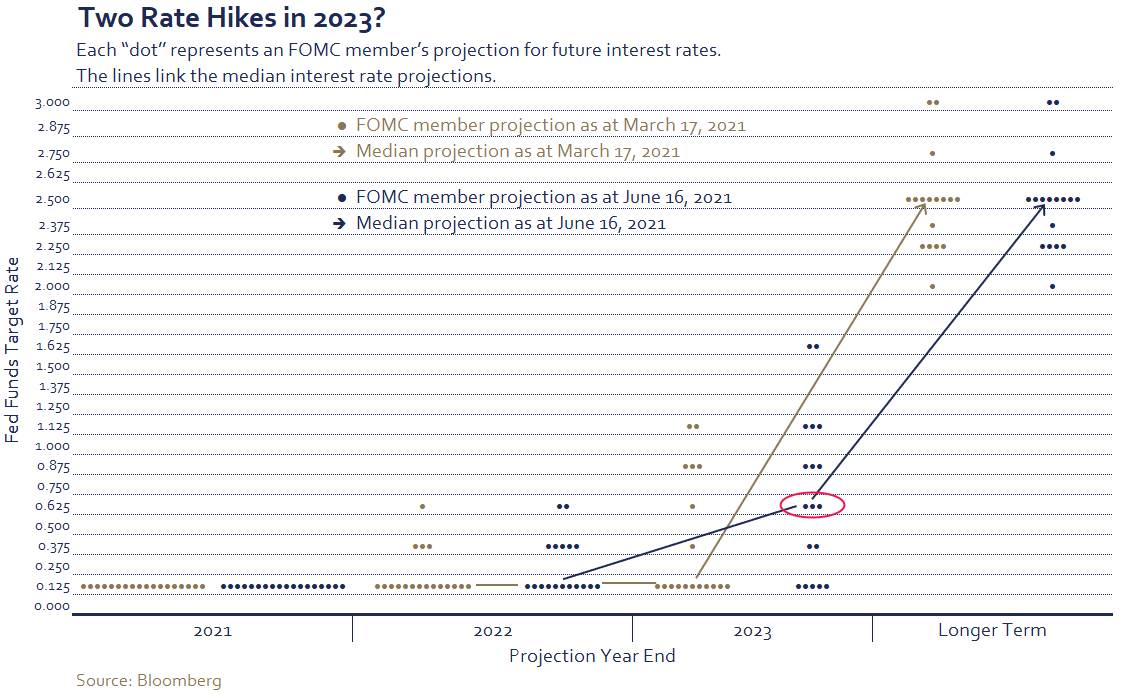
While higher inflation is unlikely to alter the Federal Reserve’s outlook – it is expected to be transitory – an improved labour market could entice some of the Federal Open Market Committee (FOMC) board members to remove some of the accommodative measures that are still in place.
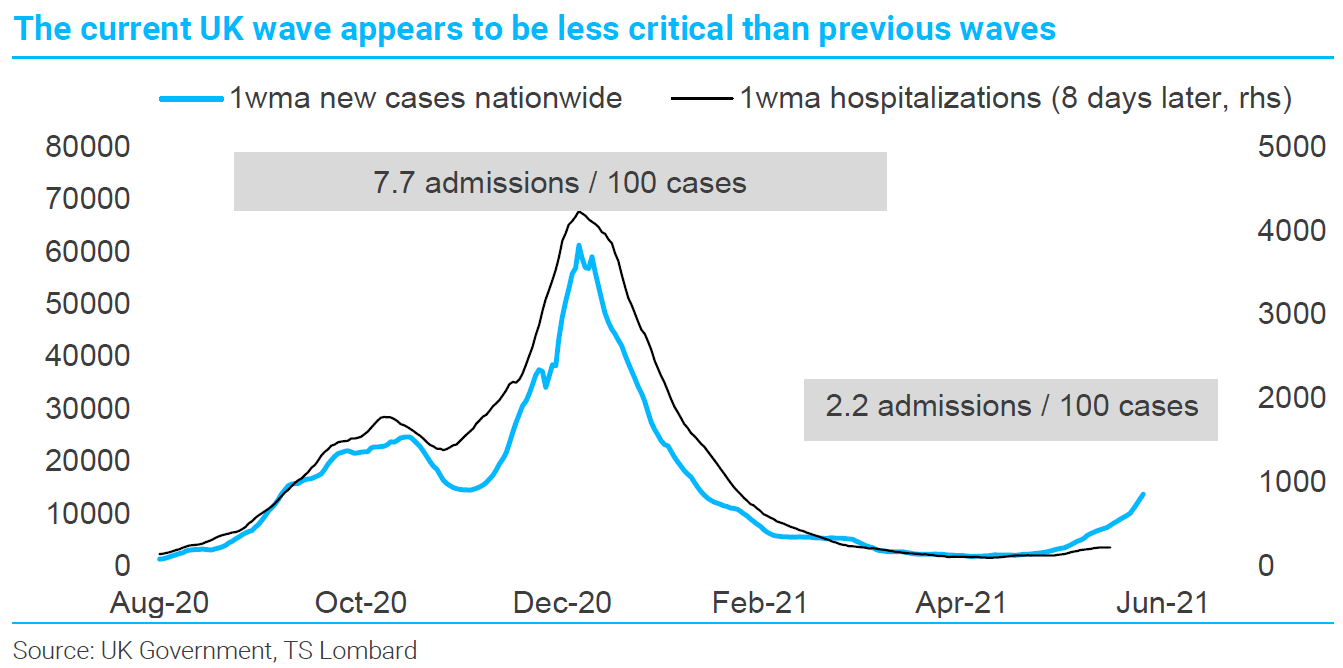
On the COVID-19 front, concerns are growing about the Delta variant. The rapid spread is driving a significant rise of positive cases in many regions around the globe. The British government was compelled to push back the last phase of its re-opening2 while other regions re-imposed some restrictions to limit the spread of the virus3,4. The good news is that hospitalizations have not accelerated as much as in previous waves. If this trend continues and the stress on national health-care systems is manageable, governments should be able to keep restrictions to a minimum and, as a result, the economic impact will be rather limited.
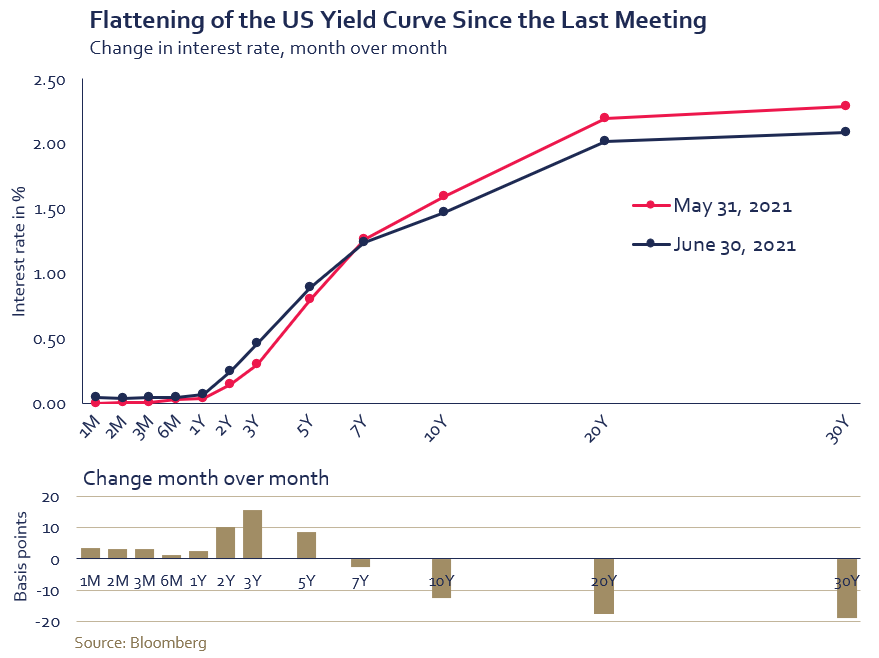
Lastly on the macro front, one of the biggest surprises last month was the hawkish shift in the FOMC interest rates forecast. The most recent “dot plots” showed that FOMC members are now pencilling in two rate hikes by 2023 compared to none before. Despite the shift in the forecast, the US Federal Reserve Chairman, Jerome Powell, downplayed the change while confirming there would be no modification to the asset purchase program. Consequently, the US interest rate curve flattened; short-term rates rose while yields on long-dated bonds declined with the US 10-year treasury yield sitting at 1.5% on June 30. This compares to 1.68% at the start of the quarter.
Market performance
The global stock market kept going; it reached another record high in June with a rise of 2.1%, marking the 5th consecutive monthly gain and putting the index 36.8% above the level recorded a year ago. North American stocks posted the strongest return in June with a 2.7% jump while European equities rose 1.6%. The Pacific region and emerging markets lagged with respective increases of 1.0% and 0.8%.
June brought a wide dispersion of sector performances. Materials ended 2.5% lower as many commodities were negatively impacted by the stronger US dollar following the more hawkish FOMC. For example, the price of gold fell by more than 7%, copper dropped 8% while lumber prices ended the month down 58% from the peak recorded in May. In contrast, energy, also considered a resource sector, advanced 4.3% thanks to the price of crude which defied the reversal observed in most commodities prices. The financial sector fell 2.2%, weighed down by the combination of lower long-term treasury yields and a flatter yield curve. Conversely, the lower rates help boost investors’ interest for IT stocks; the sector boasted a strong 6.5% return.
Conclusion
Peak economic growth, stimulus and earnings revisions, combined with stretched valuations and extended investor sentiment, continue to justify a defensive positioning.
We welcome any questions or comments you may have. We can be reached at service@hexavest.com.
- https://www.reuters.com/business/us-jobless-claims-dropping-faster-states-ending-federal-benefit-2021-06-24/
- https://www.reuters.com/world/uk/how-uk-pm-johnson-decided-delay-covid-reopening-2021-06-15/
- https://www.cnn.com/2021/06/27/australia/sydney-lockdown-australia-covid-pandemic-intl-cmd/index.html
Important Information and Disclosure
Source of all data and information: Hexavest and MSCI as at June 30, 2021, unless otherwise specified.
This material is presented for information and illustrative purposes only. The opinions expressed in this document represent the current, good-faith views of Hexavest at the time of publication and are provided for limited purposes, are not definitive investment advice, and should not be relied on as such. The information presented herein has been developed internally and/or obtained from sources believed to be reliable; however, Hexavest does not guarantee the accuracy, adequacy, or completeness of such information. Predictions, opinions, and other information contained herein are subject to change continually and without notice and may no longer be true after the date indicated. Hexavest disclaims responsibility for updating such views, analyses or other information. Different views may be expressed based on different investment styles, objectives, opinions or philosophies.
All references to the “Hexavest ACWI equity portfolio”, to the “ACWI Equity representative portfolio”, to the “portfolio”, or to their performance in this document refer to an actual portfolio managed by Hexavest which is used to objectively represent the firm’s Global ACWI Equity strategy. The performance of this representative portfolio has been included in Hexavest’s ACWI Composite (Composite) since its inception in 2014. The Composite includes portfolios that invest primarily in equities of companies located in the developed markets and emerging markets of Americas, Europe & Middle East and Asia Pacific. Hexavest uses an investment approach that is predominantly “top-down” to construct diversified portfolios that typically contain more than 275 stocks. Asset allocation between regions, countries, currencies, and sectors can deviate substantially from that of the benchmark. Some portfolios may invest a small portion of their assets in countries and currencies not included in the benchmark. A client’s actual holdings, performance and investment experience will be different from that shown.
Gross-of-fee performance results are presented before management and custodial fees but after all trading commissions and withholding taxes on dividends, interest and capital gains, when applicable. Such fees and expenses would reduce the results shown. Fee levels may vary from client to client depending on the portfolio size and the ability of the client to negotiate fees.
The MSCI ACWI Index is a broad-based securities market index and used for illustrative purposes only. The MSCI ACWI Index is a free float-adjusted market capitalization weighted index that is designed to measure the equity market performance of developed and emerging markets. Performance for the MSCI ACWI Index is shown “net”, which includes dividend reinvestments after deduction of foreign withholding tax. Broad-based securities indices are unmanaged and are not subject to fees and expenses typically associated with managed accounts or investment It is not possible to invest directly in an index. MSCI data may not be reproduced or used for any other purpose. MSCI provides no warranties, has not prepared or approved this document, and has no liability hereunder.
Past performance does not predict future results. This material may contain statements that are not historical facts (i.e., forward-looking statements). Any forward-looking statements speak only as of the date they are made, and Hexavest assumes no duty to and does not undertake to update forward-looking statements. Forward-looking statements are subject to numerous assumptions, risks, and uncertainties, which change over time. Future results may differ significantly from those stated in forward-looking statements, depending on factors such as changes in securities or financial markets or general economic conditions. Not all Hexavest’s recommendations have been or will be profitable. Investing entails risks and there can be no assurance that Hexavest will achieve profits or avoid incurring losses. It should not be assumed that any investor will have an investment experience similar to returns shown.
This material is for the benefit of persons whom Hexavest reasonably believes it is permitted to communicate to and should not be reproduced, distributed or forwarded to any other person without the written consent of Hexavest.