What (didn’t) happen in the February sell-off
March 15, 2018
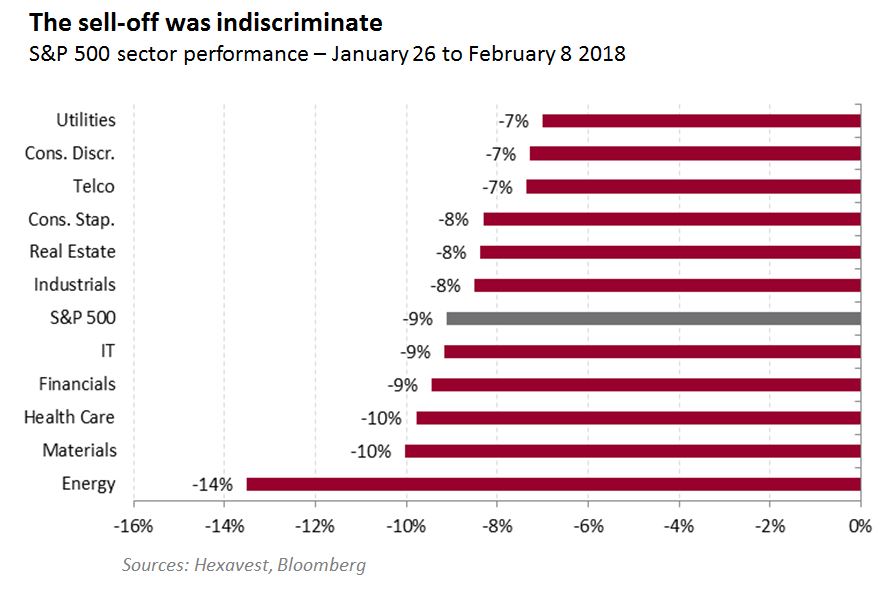
From January 26 to February 8, the S&P 500 sold off by 9%. The sell-off was driven by systematic risk-targeting strategies that responded to a rise in equity volatility. As these strategies are invested in futures, they sold off the whole index, which explains the low dispersion of sector returns during this period.
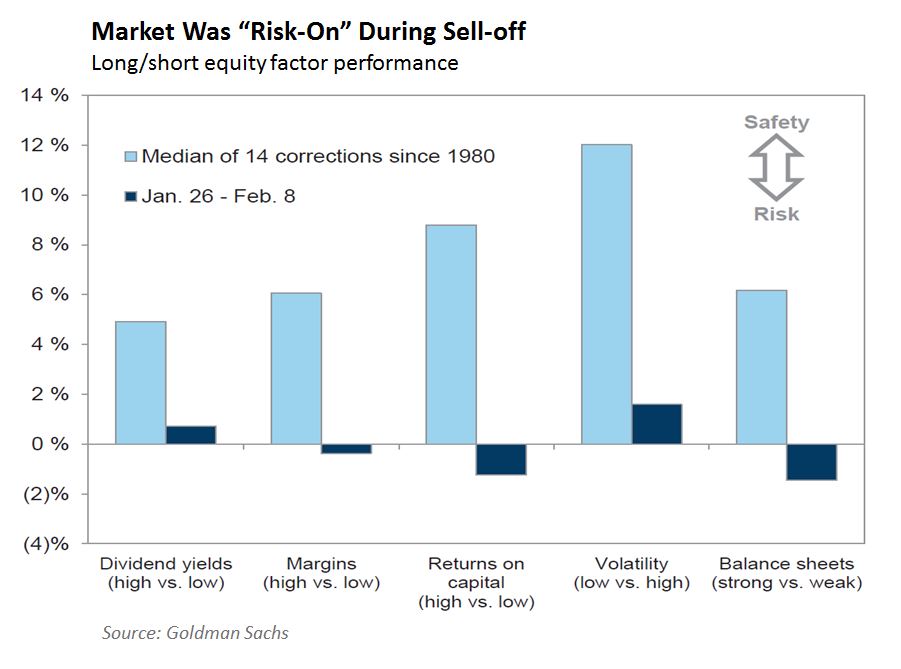
Another way of viewing this is in factor performance; in a correction, high dividend-yielding stocks and quality normally outperform. This was clearly not the case.
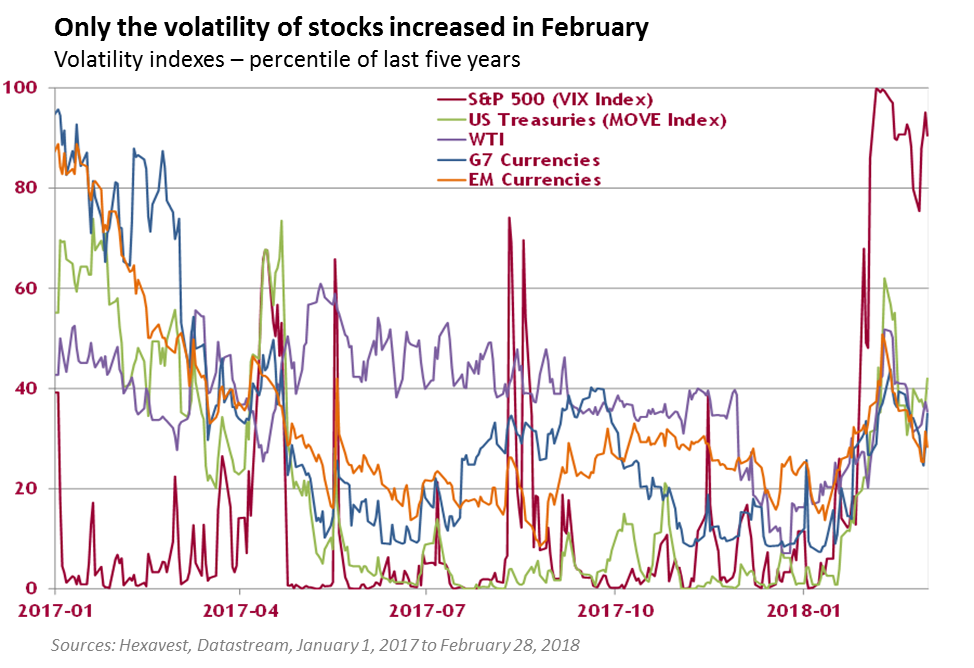
As important, only the volatility of stocks increased materially and not that of other asset classes, such as rates or currencies. This is why we only saw a decline in equities.
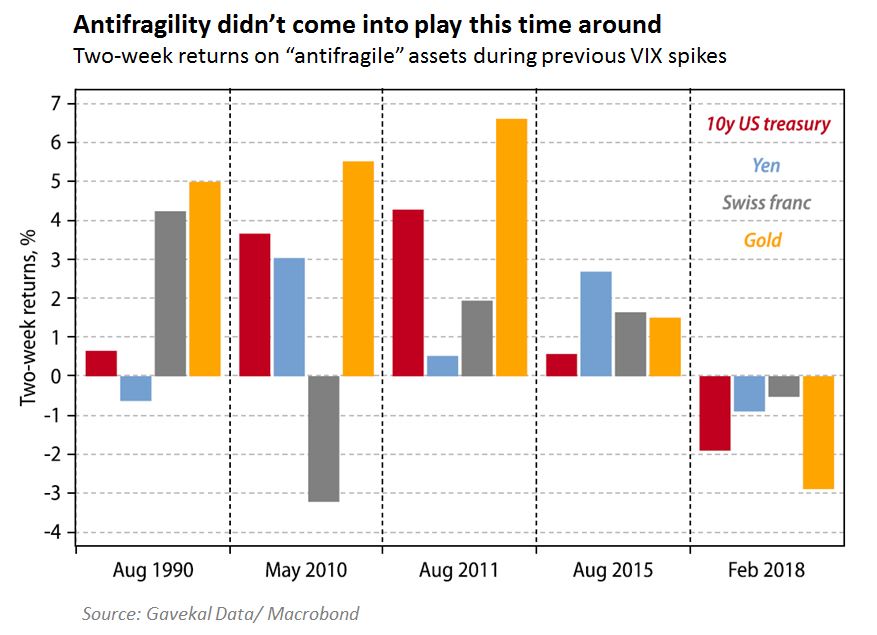
Therefore, safe haven assets such as Treasuries, gold or the Swiss franc did not respond in a “risk-off” manner.
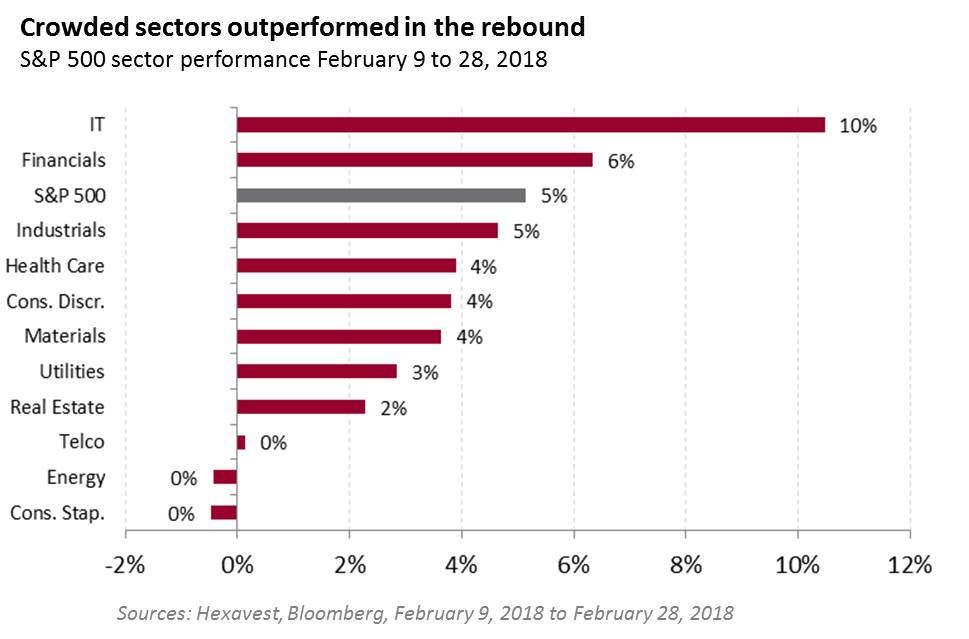
Subsequent to the correction, the market rallied by 5% (a 99th percentile one-week move vs. S&P 500 trading history), led by the two most crowded sectors in the S&P 500 (financials and technology).
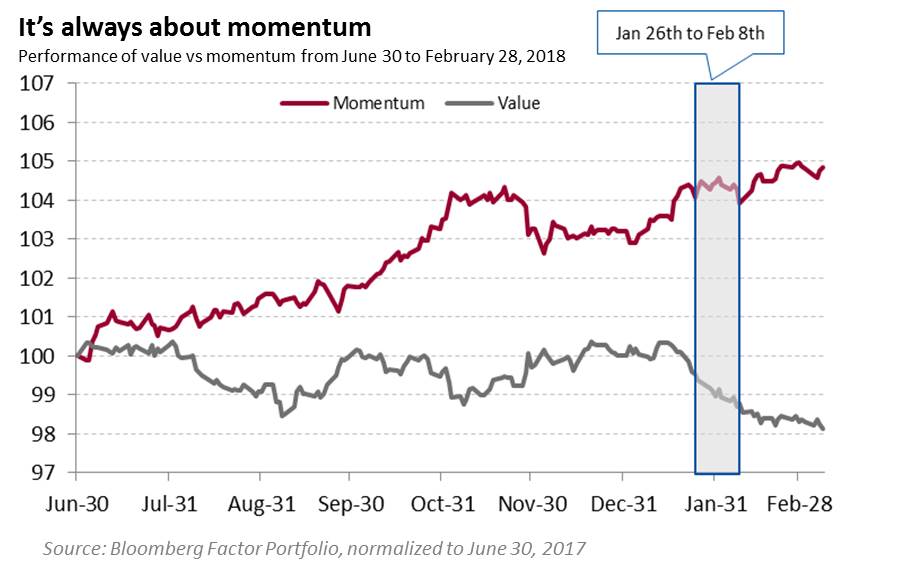
Through the lens of factors, we can see that the momentum factor, which barely registered the sell-off, rose subsequently. In contrast, the value factor fell before, during and after the sell-off.
The sell-off was technical in nature
It was driven by systematic strategies being forced to de-risk in the face of rising volatility. This was not a true flight to safety or a real correction. Investors, conditioned to buy the dip, continued to do so into the crowded longs of tech/FANG and banks. As such, our portfolio did not add as much value as we would have anticipated during a period of negative market returns.
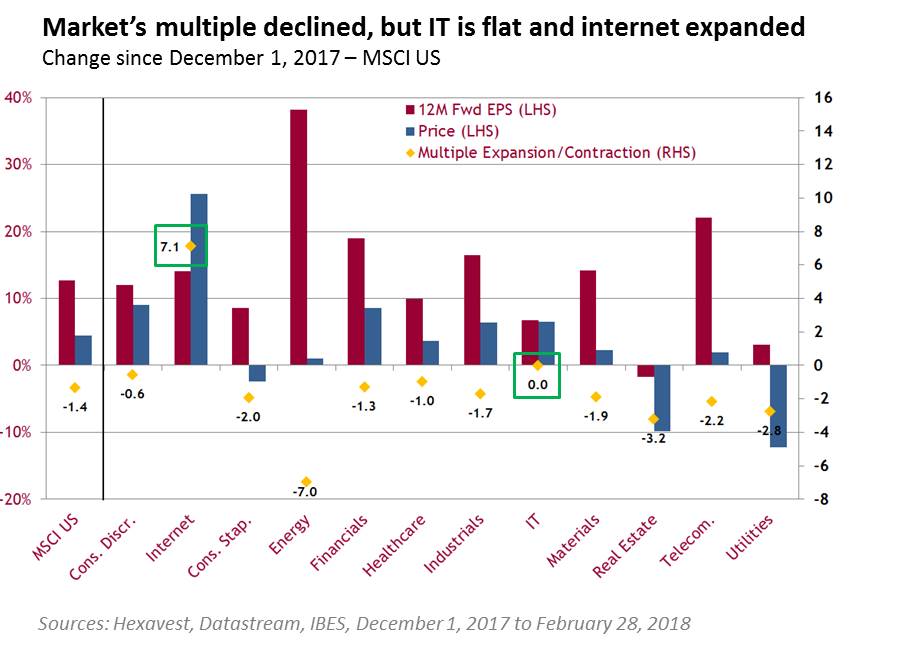
In a true correction, we expect our defensive positioning to pay off in a much more meaningful way. In fact, the case for defensive sectors has only strengthened. The multiple of the S&P 500 has contracted somewhat, but this has not been uniform. Since December 1 (we chose December to be fair and incorporate the pricing of tax cuts), the market multiple has declined by 1.4x. However, this was led by defensive sectors, while sectors such as IT maintained their multiple and the internet industry saw an increase.
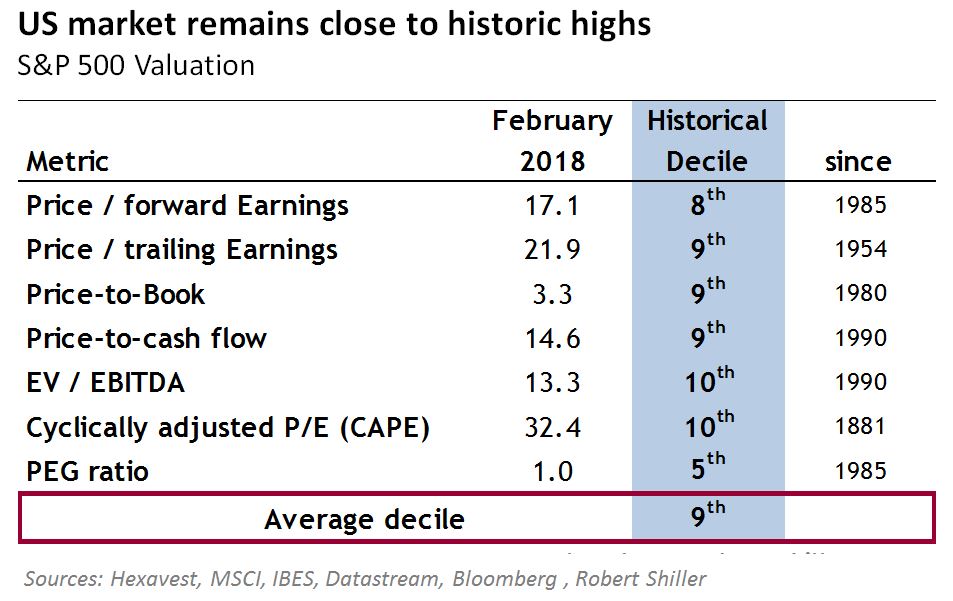
All in all, the market remains close to the most expensive it has ever been, even with bullish EPS growth estimates.
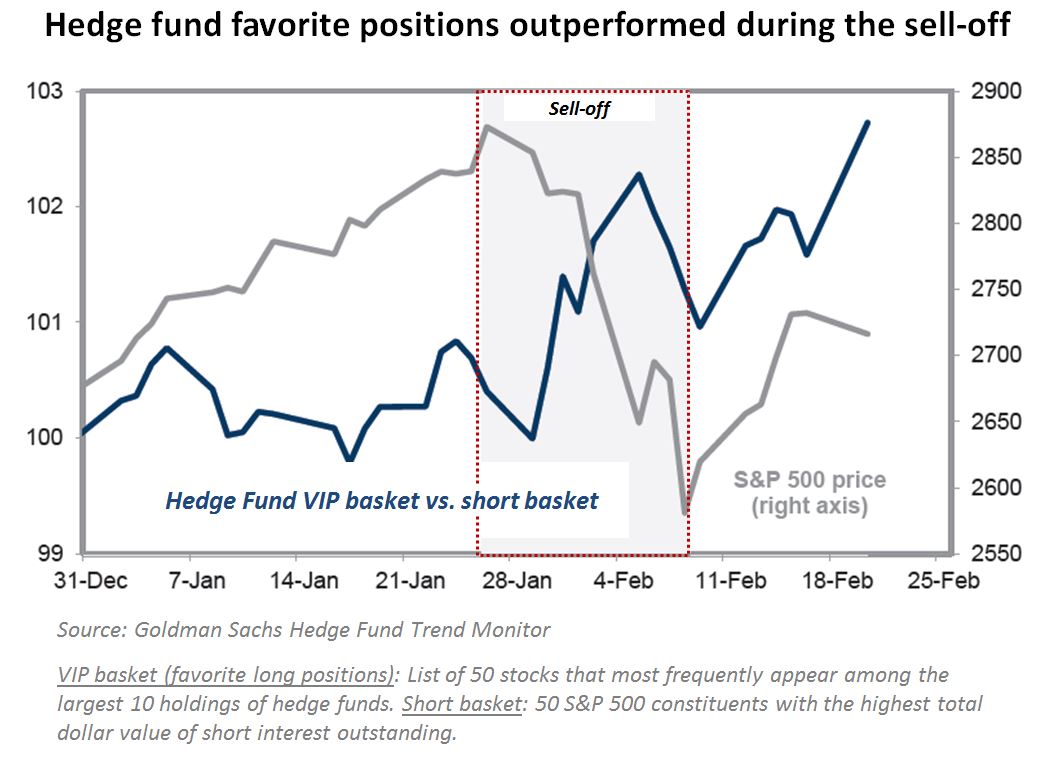
The rise in volatility was too short to shake investors’ perception of invincibility. As investors are massively overweight momentum and growth stocks, they did not see the sell-off in the same way, and, in fact, many will have added alpha, as popular longs outperformed popular shorts (as defined by Goldman Sachs; see graph below).
As such, our valuation and sentiment vectors did not move materially for the United States, and we continue to have conviction that the US market is set for a correction in the coming months.
Returns presented are those of the MSCI net indexes in local currencies. MSCI makes no express or implied warranties or representations and shall have no liability whatsoever with respect to any MSCI data contained herein. The MSCI data may not be further redistributed or used as a basis for other indexes or any securities or financial products. This report is not approved, reviewed or produced by MSCI.
References to specific companies and securities do not constitute a recommendation to buy, sell, or hold such securities, nor an indication that Hexavest or its affiliates have recommended such securities for any client account. The operating performance of the FANGs is shown for illustrative purposes only. Past performance is no guarantee of future results.
The information included in this article is presented for illustrative and discussion purposes only. It is meant to provide an example of Hexavest’s investment management capabilities and should not be construed as investment advice or as a recommendation to purchase or sell securities or to adopt any investment strategy. Any investment views and market opinions expressed are subject to change at any time without notice. This document should not be construed or used as a solicitation or offering of units of any fund or other security in any jurisdiction.
The opinions expressed in this article represent the current, good faith views of Hexavest at the time of publication and are provided for limited purposes, are not definitive investment advice, and should not be relied on as such. The information presented herein has been developed internally and/or obtained from sources believed to be reliable; however, Hexavest does not guarantee the accuracy, adequacy, or completeness of such information. Predictions, opinions, and other information contained herein are subject to change continually and without notice and may no longer be true after the date indicated. Hexavest disclaims responsibility for updating such views, analyses or other information. Different views may be expressed based on different investment styles, objectives, opinions or philosophies. It should not be assumed that any investments in securities, companies, countries, sectors or markets described were or will be profitable. It should not be assumed that any investor will have an investment experience similar to any portfolio characteristics or returns shown. This material may contain statements that are not historical facts (i.e., forward-looking statements). Any forward-looking statements speak only as of the date they are made, and Hexavest assumes no duty to and does not undertake to update forward-looking statements. Forward-looking statements are subject to numerous assumptions, risks, and uncertainties, which change over time. Future results may differ significantly from those stated in forward-looking statements, depending on factors such as changes in securities or financial markets or general economic conditions. Not all of Hexavest’s recommendations have been or will be profitable.