Regime change in volatility
May 28, 2020
Jean-Pierre Couture
During the long period of calm that preceded the COVID-19 shock, investors forgot previous bouts of uncertainty and turbulence. Hexavest expects a return to volatility in the financial markets amid the ongoing uncertainty affecting economic activity as well as monetary and fiscal policies. Our Chief Economist, Jean-Pierre Couture, provides his explanations and perspectives.
The calm before the storm: 2015-2019
The five years leading up to the COVID-19 pandemic was a particularly uneventful time on the global stock market. Equity volatility1 from 2015 to 2020 was well below the historical norm. In fact, over the past 50 years, volatility was greater than in 2015-2020 almost 70% of the time.
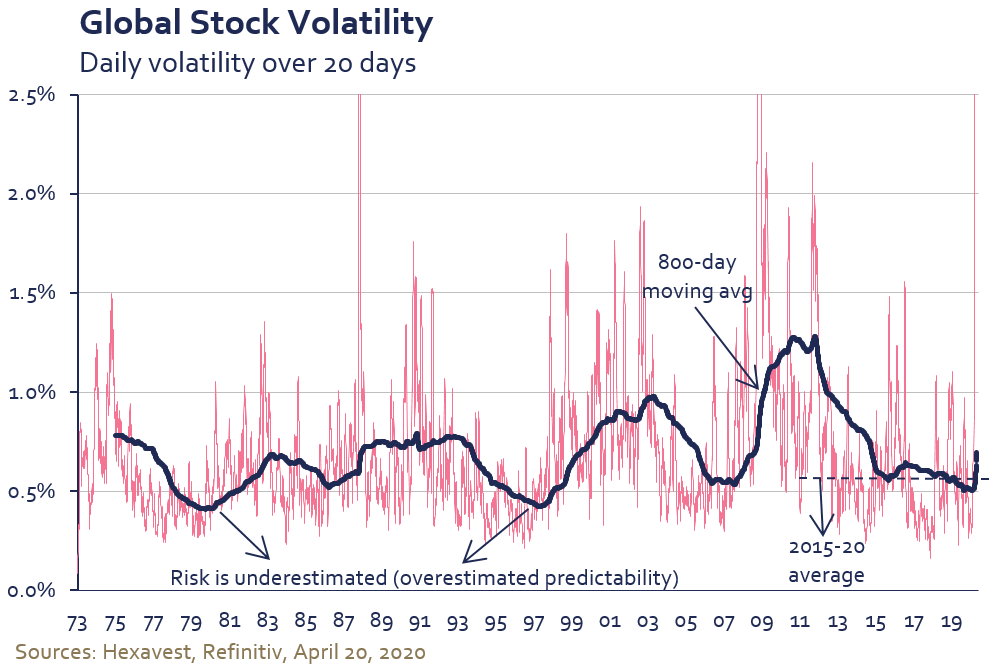
During periods of low turbulence, the confidence levels of households, investors, governments and businesses are usually at their highest. They assume that the prevailing calm will continue indefinitely, and they lower their guard, increase their debt load and become more risk tolerant. Because they tend to be rewarded for risks recently taken on, they are encouraged to assume even more risk, until a shock occurs and the excesses are purged. This sequence led to the technology bubble of 2000, the financial crisis of 2008 and the excessive corporate debt seen today.
Long periods of calm can therefore lead to complacency in the face of risks, excesses and significant macrofinancial imbalances2. Moreover, during the last long lull, from 2015 to 2020, central banks kept interest rates extremely low, adding fuel to the risk appetite of economic agents.
Turbulence cycles last a number of years
Historically, purges of macrofinancial excesses have led to periods of financial volatility lasting several years. In fact, the bouts of turbulence have generally been longer than the periods of calm.
The explanation can be found partly in the performance of the real economy. Economies take time to recover from past excesses and to regain a solid footing. It takes more than a few quarters for households, businesses, governments and investors to regain confidence and rebuild resources after a shock that causes a recession, bankruptcies, deficits, unemployment and financial losses. The persistent macroeconomic uncertainty fuels turbulence in the financial markets, as the economic data cause surprise and often disappointment.
In short, an unstable real economy will lead to volatile financial markets. The next two graphs use the United States as a case study given the availability of a long history of economic and financial data3.
The graph below illustrates how the record stability of U.S. job gains from 2013 to 2020 contributed significantly to the climate of confidence.
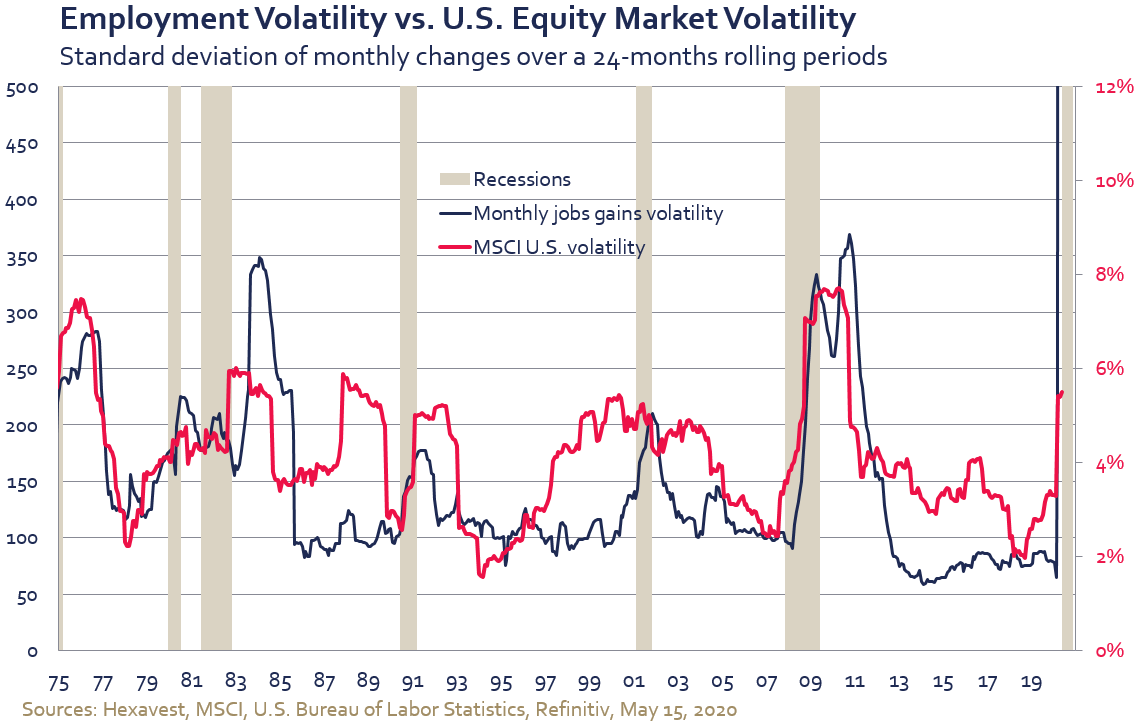
During that period, an average of 200,000 jobs was created each month with little variability. This created a perception that the future was much more predictable than it was from 2009 to 2012.
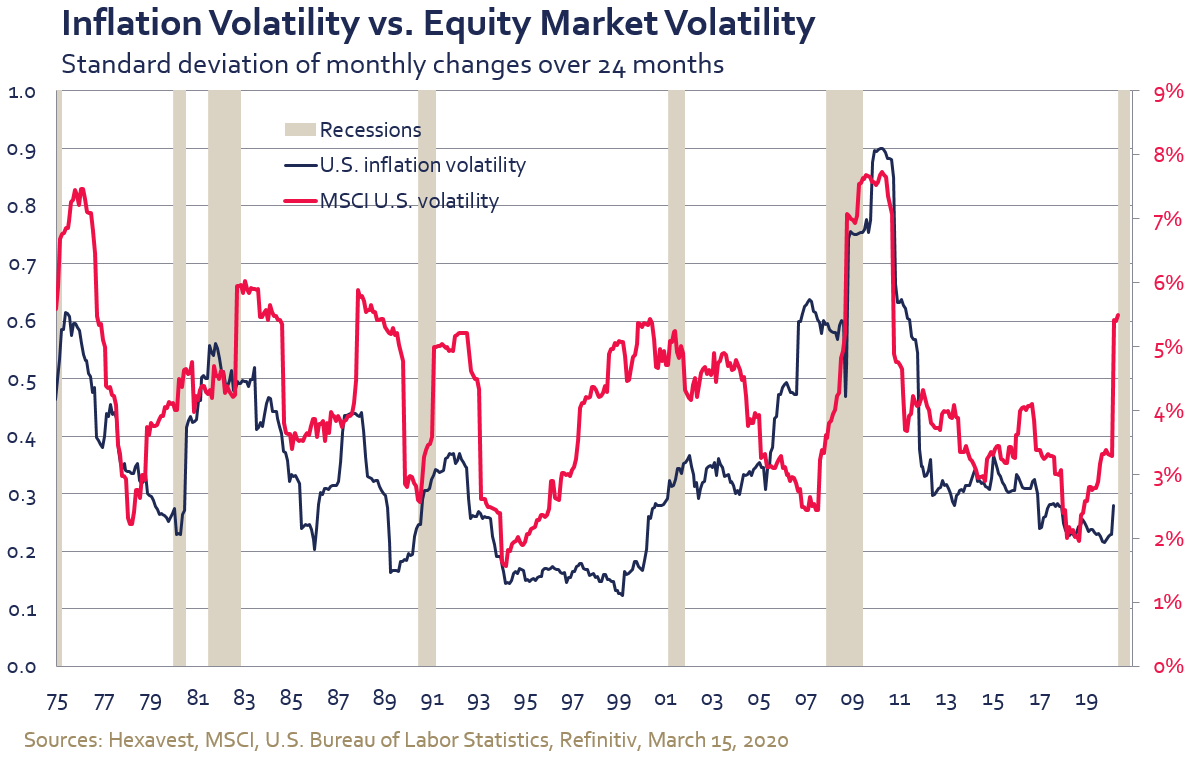
The same observation applies to the rate of inflation. Variable inflation causes central bankers to be nervous and interest rates to be unstable. Nasty inflation surprises contribute to financial market turbulence, as shown in the graph below. In contrast, a low, stable rate of inflation is conducive to a predictable and accommodative monetary policy that reassures investors.
Predictability plays a major role
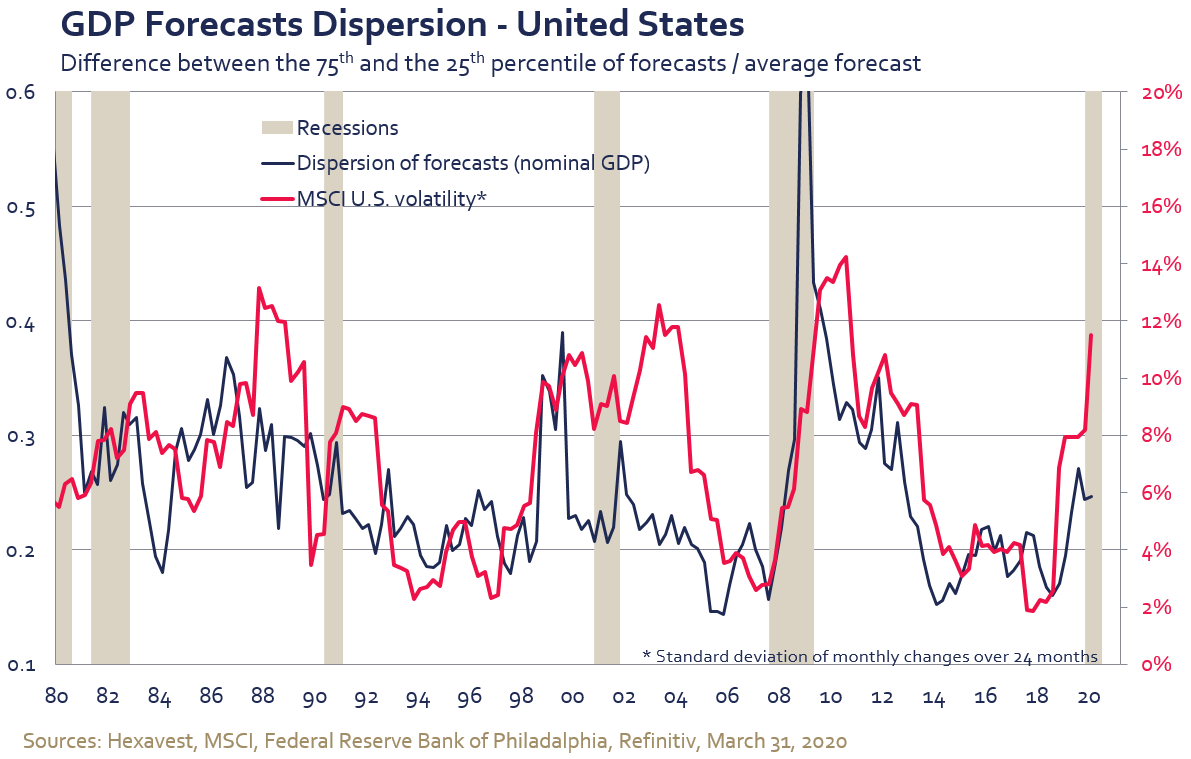
Economic uncertainty or predictability therefore plays an important role. To estimate the degree of economic uncertainty, we measure disagreement among economists. Greater dispersion in economic forecasts points to a more uncertain future. In contrast, when the forecasts are very similar, the consensus is strong, which leads to a better visibility. The next graph shows that disagreement about GDP forecasts among economists often coincides with tumultuous periods on the stock markets.
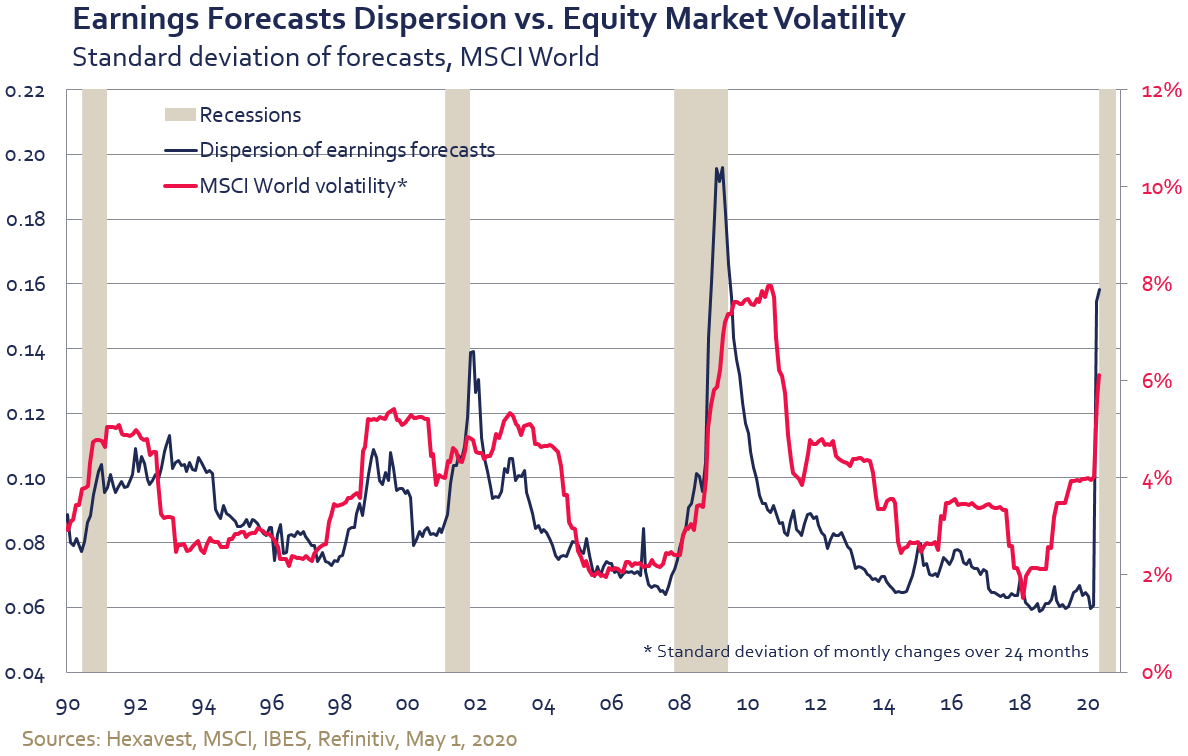
This phenomenon can also be seen among financial analysts. The chart below illustrates the relationship between the variance in analysts’ corporate earnings forecasts and global equity volatility. Higher dispersion indicates a greater level of uncertainty about future earnings growth and more confusion for investors. From 2017 to 2020, analysts were generally in agreement about earnings growth and uncertainty as measured by stock market volatility was low. This uncertainty metric also shows that forecasters tend to overestimate the predictability of the economy and of earnings on the eve of recessions.
Economic policies create another source of uncertainty
Economic activity isn’t the only macro variable that affects financial market volatility. Economic policies – monetary and fiscal policy, international trade relations, regulation, tariffs, etc. – affect the level of market turbulence. Generally speaking, financial markets are more volatile when the direction of economic policies is harder to predict or understand.
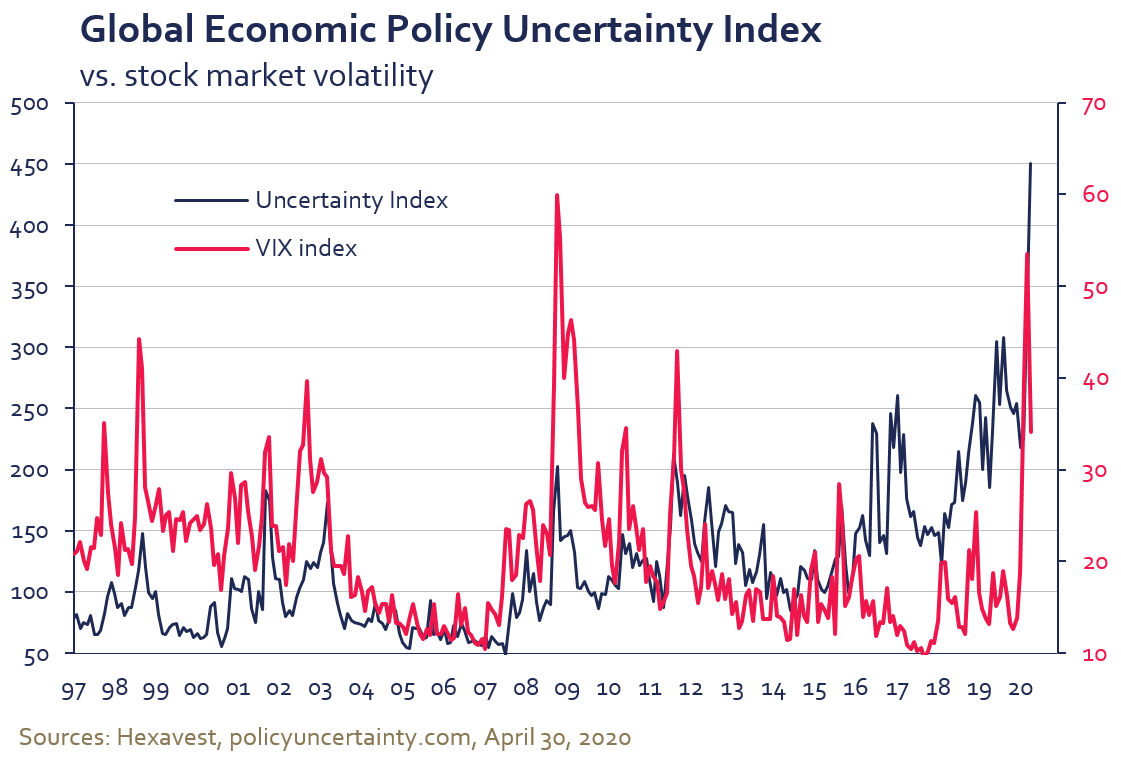
The graph below shows the relationship between the Economic Policy Uncertainty Index4 and the VIX Index, a measure of U.S. market volatility. The relationship isn’t perfect: the sharp rise in political uncertainty after Donald Trump’s election victory in late 2016 and at the height of China-U.S. trade tensions in 2019 had no discernable impact on the VIX. With the exception of these episodes, however, the historical relationship is fairly close, the European crisis from 2010 to 2013 being a case in point.
The coming years will see various sources of uncertainty
Economic growth: The COVID-19 crisis struck at a time of great financial vulnerability. The level of corporate debt was high before the crisis5. It has now worsened with the sharp fall-off in global economic activity. This situation will prolong the recession, causing bankruptcies and permanent layoffs. The V-shaped economic recovery expected by the consensus of economists and analysts is unlikely, as discussed in the article we published on this subject in April.
Public finances: The state of public finances is another source of uncertainty. The record stimulus deployed in 2020 to support households and businesses, combined with falling tax revenues, has pushed debt to record levels in a number of countries. The U.S. federal government’s debt is expected to exceed 100% of GDP, in line with the previous peak after the Second World War. Governments will eventually have to curtail spending and increase taxes to reverse the deterioration of their public finances. It would not be surprising if large companies, particularly the major technology, media and e-commerce monopolies, faced a significant tax grab. Wall Street, whose bacon has once again been saved by the government, could also be targeted.
Monetary policy: With the interest rates set by the major central banks already at zero (or even lower), traditional stimulus tools have been exhausted. It is difficult to predict how far central bank asset purchases will go and how much longer investors will put their trust in these unconventional policies. Who can predict the effect that massive and unprecedented money printing will have on inflation? We think the zero-interest-rate policy is largely responsible for the excessive levels of corporate debt. Will central bankers go even further with their experiments if the current crisis proves to be deflationary?
Trade tensions: The deteriorating trade and political relations between China and the United States have the potential to disrupt supply chains, which have been optimized over the years according to the comparative advantages of the various countries. Changes to the production chain could mean higher costs for businesses and consumers. Corporate profit margins could suffer, and investment decisions could be postponed in the face of uncertainty and unappealing margins.
U.S. elections: Economic policies and discourse will have only one very-short-term goal in the United States this year: the November elections. All long-term issues may be sidelined or, worse still, exacerbated or denigrated, depending on voter preferences. The rhetoric around trade relations with China and Europe may turn even harsher, adversely affecting investor sentiment and the business climate.
Conclusion
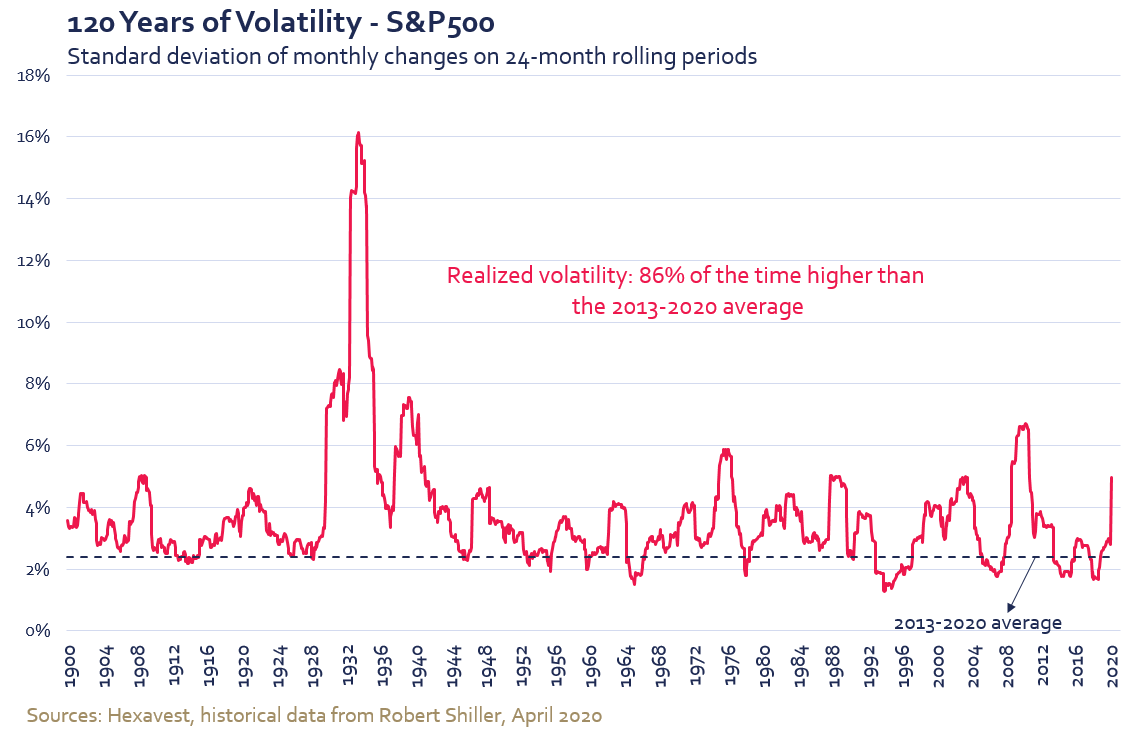
The long period of calm that preceded the COVID-19 shock caused investors to forget the previous bouts of uncertainty and turbulence. The chart below shows U.S. stock market volatility over the last 120 years. We can see that the period of low turbulence from 2013 to 2020 was a far cry from the historical norm.
Some of the issues we have raised in this article are easier to resolve than others. For example, trade relations could rapidly improve, since China and the United States have every interest in reaching an agreement. This scenario could well happen after (or just before) the elections. Even so, the explosion of public deficits, the limitations and impacts of experimental monetary policies and the extent of the damage caused by the current recession are far more complex issues. Even so, against this rather dark backdrop, there will also be good news, such as advances in the development of effective COVID-19 treatments or a vaccine, and a return to a degree of normality once the virus has been contained. In such a context, we expect the new volatility cycle that began in 2020 to span several years, rather than several quarters.
1 Measured with an average of 800 days of daily return dispersion over a 20-day moving period. Datastream Global Equity Index.
2 The concept that “stability breeds instability” was developed by the U.S. economist Hyman Minsky and is explained in his book Stabilizing an Unstable Economy (1986).
3 The volatility of economic data does not explain everything. The stock market crash of 1987 is a fine example: it was not caused by any abrupt change in the real data.
4 Policyuncertainty.com: This index consists of three types of indicator: newspaper coverage, federal tax code provisions set to expire and disagreement among economic forecasters.
5 The IMF, the OECD, the ECB and the U.S. Federal Reserve were all concerned about corporate overindebtedness in 2019, as noted in the following publications: Global Financial Stability Report: Lower for Longer, IMF, October 2019; Financial Stability Report, U.S. Federal Reserve, May 2019; and Corporate Bond Markets in a Time of Unconventional Monetary Policy, OECD, February 2019.
NOTES
Source of all data and information: Hexavest as at April 30, 2020, unless otherwise specified.
Returns for the MSCI ACWI Index are shown net of deduction of foreign withholding tax. MSCI data may not be reproduced or used for any other purpose. MSCI provides no warranties, has not prepared or approved this document, and has no liability hereunder. Past performance is not necessarily indicative of future performance.
This material is presented for informational and illustrative purposes only. It is meant to provide an example of Hexavest’s investment management capabilities and should not be construed as investment advice or as a recommendation to purchase or sell securities or to adopt any particular investment strategy. Any investment views and market opinions expressed are subject to change at any time without notice. This document should not be construed or used as a solicitation or offering of units of any fund or other security in any jurisdiction.
The opinions expressed in this document represent the current, good-faith views of Hexavest at the time of publication and are provided for limited purposes, are not definitive investment advice, and should not be relied on as such. The information presented herein has been developed internally and/or obtained from sources believed to be reliable; however, Hexavest does not guarantee the accuracy, adequacy, or completeness of such information. Predictions, opinions, and other information contained herein are subject to change continually and without notice and may no longer be true after the date indicated. Hexavest disclaims responsibility for updating such views, analyses or other information. Different views may be expressed based on different investment styles, objectives, opinions or philosophies. It should not be assumed that any investments in securities, companies, countries, sectors or markets described were or will be profitable. It should not be assumed that any investor will have an investment experience similar to any portfolio characteristics or returns shown. This material may contain statements that are not historical facts (i.e., forward-looking statements). Any forward-looking statements speak only as of the date they are made, and Hexavest assumes no duty to and does not undertake to update forward-looking statements. Forward-looking statements are subject to numerous assumptions, risks, and uncertainties, which change over time. Future results may differ significantly from those stated in forward-looking statements, depending on factors such as changes in securities or financial markets or general economic conditions. Past performance is not necessarily indicative of future performance. Not all of Hexavest’s recommendations have been or will be profitable.
This material is for the benefit of persons whom Hexavest reasonably believes it is permitted to communicate to and should not be reproduced, distributed or forwarded to any other person without the written consent of Hexavest. It is not addressed to any other person and may not be used by them for any purpose whatsoever. It expresses no views as to the suitability of the investments described herein to the individual circumstances of any recipient or otherwise.