Are investors blind to the growing list of concerns?
September 8, 2021
The COVID-19 pandemic does not appear to be going away anytime soon. A resurgence of cases in several regions is negatively impacting economic activity, with Asian countries seemingly withstanding the worst of the latest wave. The increasing number of cases has failed to have lasting impact on investors’ sentiment, but a growing list of developments suggests a strong likelihood of a more pronounced deceleration in data this quarter.
Governments in some hard-hit countries such as Australia and China have acted swiftly to control the spread of the virus. Closer to home, corporations are delaying their staff’s return to the office, and large conventions such as the New York City auto show are being cancelled or pushed back.
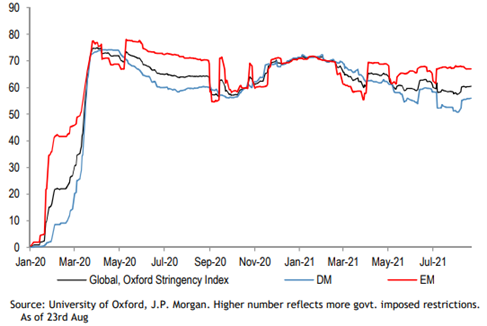
As a result, the global stringency index, which tracks a number of government-imposed restrictions, picked up slightly last month. The persistently elevated level demonstrates that COVID-19 continues to disrupt our daily routine, and this is unlikely to abate any time soon.
Oxford Stringency Index
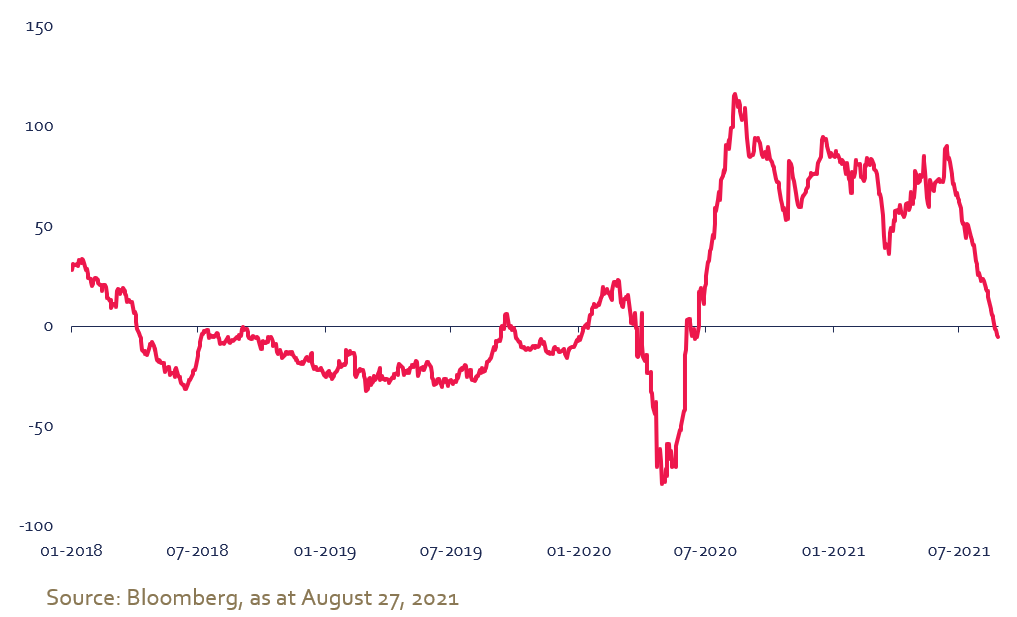
While the level of economic activity remains high by historical standards, there is now clear evidence of decelerating growth although investors’ expectations remain quite rosy. The sharp slowdown in the Citigroup Economic Surprise Index shows that recent economic data have been below expectations. The index has fallen below zero, its lowest level since the recovery started in the spring of 2020.
Furthermore, supply chain disruptions linked to semiconductors, shipping, and labour shortages just to name a few remain a key concern for producers and could exacerbate the deceleration in economic activity in the coming months1,2.
Citigroup Economic Surprise Index
The recent slowdown has begun to trickle down into analysts’ growth forecasts. According to the data compiled by Consensus Economics3, growth expectations for the 2021 World real GDP were revised down 20 basis points in August. In addition, while the US economy is expected to grow by 6.2%, this strong pace has been given a 50 basis points haircut over the last 2 months.
The increasing probability of slower economic growth has yet to have an impact in the analyst community. We have not seen any downward revisions in earnings expectations: the 12-month forward earnings forecasts for the US and global equities currently stand 21% and 18% above their December 2019 respective levels. This compares to a US real GDP that is currently only 1% above its pre-COVID level.
In the face of elevated growth expectations, any hiccup could leave a scar on financial markets.
Despite an increasingly difficult macro outlook, investors are hopelessly holding onto the belief that the US Federal Reserve will provide a backstop in the event of a market correction. Federal Open Market Committee (FOMC) President Jerome Powell added fuel to the fire with a dovish speech during the Jackson Hole symposium. Despite calls from some committee members for tapering (i.e., reducing Treasury purchases), Powell’s comments telegraphed a measured approach for removing the mindboggling amount of liquidity that has been injected in the economy and financial markets over the last 18 months and that has kept interest rates low.
While equity markets are sitting at record levels, the latest earning season (Q2 2021) provided some hints that expectations remain very high. Yet, investors’ optimism seems to be waning as the very strong earnings were met by a half-hearted response: market participants did not reward companies that beat expectations.
US stock price reaction* to quarterly EPS beats or misses:
No reward for exceeding expectations
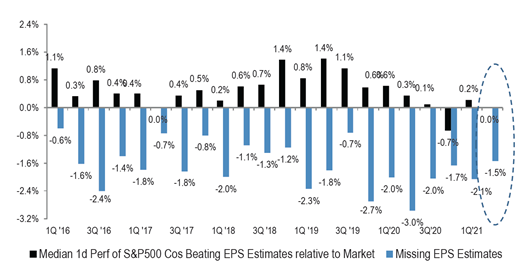
Sources: J.P. Morgan, Bloomberg Finance L.P., as at August 6, 2021
* relative 1-day performance
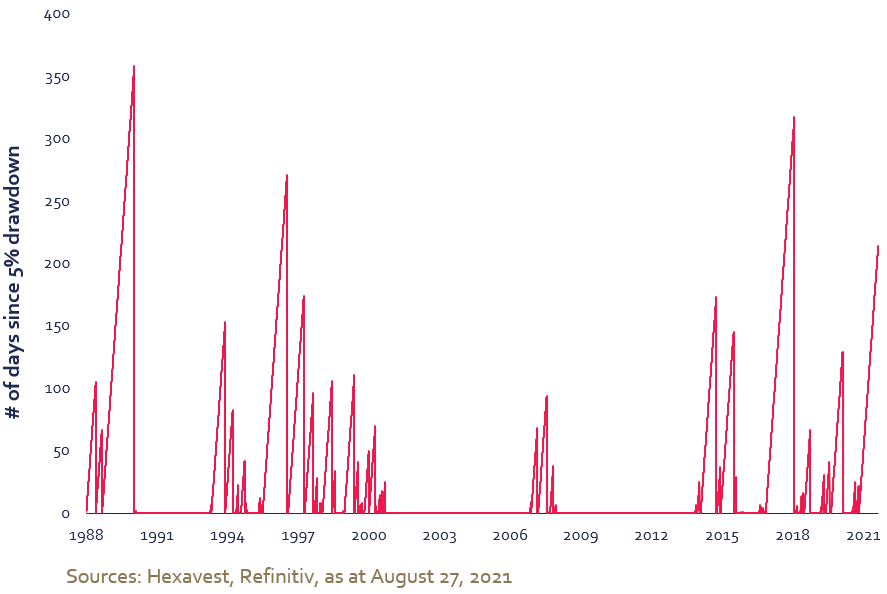
Investors appear to be resisting the temptation to bet against equity markets as long as central banks continue to provide support. Thus far in the third quarter, the largest pullback in global equities was 2.5%, and it has been more than 200 days since the MSCI World index has recorded a drawdown of more than 5%, the fourth longest period in the last 33 years.
MSCI World Index: Number of days since 5% drawdown
Market performance
In August, equity markets continued their march higher with the US equity market doubling in 354 days from the low registered in March 2020. According to CNBC, this is the fastest doubling in a bull-market since WWII4. The dovish message from Powell helped propel the NASDAQ index which registered a new record high level on 9 trading days during the month.
The MSCI ACWI index rose 2.6% in August with all regions ending higher. A flat return in China (0.0%) held emerging markets (+2.3%) slightly back while both North America’s and Europe’s equity benchmarks posted strong returns of 2.8% and 2.2% respectively. While global equities stand at their highest level on record, the MSCI Emerging market index is 8% below, its 52-week high as investors continue to worry about the ongoing regulatory crackdown in China.
Financials were the best performing sector last month with a 4.2% gain, bringing the year-to-date return to a solid 24%. Utilities came in second, advancing by 3.9%. In contrast, materials (-0.2%) offered the worst return while the energy sector managed to finish in positive territory (+0.4%) despite the drop in the price of oil.
Conclusion
Considering that we are heading into a typically weak period for global equities at a time when growth, valuation and sentiment indicators are suggesting we are past the peak in profitability, a defensive portfolio allocation is key to protect your capital given the increasing likelihood of a market correction.
We welcome any questions or comments you may have. We can be reached at service@hexavest.com.
- https://www.fleetowner.com/news/supply-chain/article/21172809/manufacturing-demand-still-strong-supply-chain-an-ongoing-challenge-ism
- https://www.cnn.com/2021/08/23/business/global-supply-chains-christmas-shipping/index.html
- Refinitiv, as at August 31, 2021
- https://www.cnbc.com/2021/08/16/sp-500-doubles-from-its-pandemic-bottom-marking-the-fastest-bull-market-rally-since-wwii.html
- All references to the “Hexavest ACWI equity portfolio”, to the “ACWI Equity representative portfolio”, to the “portfolio”, or to their performance in this document refer to an actual portfolio managed by Hexavest which is used to objectively represent the firm’s Global ACWI Equity strategy. For more information and disclosures, we encourage you to consult the Important Information and Disclosure section of this document.
- The return presented is gross of management fees. Gross-of-fee performance results are presented before management and custodial fees, but after all trading commissions and withholding taxes on dividends, interest, and capital gains, when applicable. It is not possible to invest directly in an index. Past performance does not predict future results.
Important Information and Disclosure
Source of all data and information: Hexavest and MSCI as at August 31, 2021, unless otherwise specified.
This material is presented for information and illustrative purposes only. The opinions expressed in this document represent the current, good-faith views of Hexavest at the time of publication and are provided for limited purposes, are not definitive investment advice, and should not be relied on as such. The information presented herein has been developed internally and/or obtained from sources believed to be reliable; however, Hexavest does not guarantee the accuracy, adequacy, or completeness of such information. Predictions, opinions, and other information contained herein are subject to change continually and without notice and may no longer be true after the date indicated. Hexavest disclaims responsibility for updating such views, analyses or other information. Different views may be expressed based on different investment styles, objectives, opinions or philosophies.
All references to the “Hexavest ACWI equity portfolio”, to the “ACWI Equity representative portfolio”, to the “portfolio”, or to their performance in this document refer to an actual portfolio managed by Hexavest which is used to objectively represent the firm’s Global ACWI Equity strategy. The performance of this representative portfolio has been included in Hexavest’s ACWI Composite (Composite) since its inception in 2014. The Composite includes portfolios that invest primarily in equities of companies located in the developed markets and emerging markets of Americas, Europe & Middle East, and Asia Pacific. Hexavest uses an investment approach that is predominantly “top-down” to construct diversified portfolios that typically contain more than 275 stocks. Asset allocation between regions, countries, currencies, and sectors can deviate substantially from that of the benchmark. Some portfolios may invest a small portion of their assets in countries and currencies not included in the benchmark. A client’s actual holdings, performance and investment experience will be different from that shown.
Gross-of-fee performance results are presented before management and custodial fees but after all trading commissions and withholding taxes on dividends, interest, and capital gains, when applicable. Such fees and expenses would reduce the results shown. Fee levels may vary from client to client depending on the portfolio size and the ability of the client to negotiate fees.
The MSCI ACWI Index is a broad-based securities market index and used for illustrative purposes only. The MSCI ACWI Index is a free float-adjusted market capitalization weighted index that is designed to measure the equity market performance of developed and emerging markets. Performance for the MSCI ACWI Index is shown “net”, which includes dividend reinvestments after deduction of foreign withholding tax. Broad-based securities indices are unmanaged and are not subject to fees and expenses typically associated with managed accounts or investment It is not possible to invest directly in an index. MSCI data may not be reproduced or used for any other purpose. MSCI provides no warranties, has not prepared or approved this document, and has no liability hereunder.
Past performance does not predict future results. This material may contain statements that are not historical facts (i.e., forward-looking statements). Any forward-looking statements speak only as of the date they are made, and Hexavest assumes no duty to and does not undertake to update forward-looking statements. Forward-looking statements are subject to numerous assumptions, risks, and uncertainties, which change over time. Future results may differ significantly from those stated in forward-looking statements, depending on factors such as changes in securities or financial markets or general economic conditions. Not all Hexavest’s recommendations have been or will be profitable. Investing entails risks and there can be no assurance that Hexavest will achieve profits or avoid incurring losses. It should not be assumed that any investor will have an investment experience similar to returns shown.
This material is for the benefit of persons whom Hexavest reasonably believes it is permitted to communicate to and should not be reproduced, distributed or forwarded to any other person without the written consent of Hexavest.