That was quite a month we just had; only 11 more to go
February 15, 2022
The month of January began just as 2021 ended with equity markets reaching a record level. The euphoria only lasted a couple of days before investors became uneasy with the prospect of rising interest rates. The US 10-year treasury yield jumped more than 30 basis points to 1.86% by the middle of the month. The initial concern stemmed from the negative impact higher interest rates has on valuation multiples and as a result, the most expensive segments of the market bore the brunt of the hit at the onset of the correction.
The MSCI World index, at the worst of the correction, declined 8.1% which is the most important drawdown since the beginning of the pandemic in early 2020. If we look back more than 30 years, a pullback of this magnitude is unusual and since there are no significant changes in the narrative, there are no reasons to suggest the correction is over.
MSCI ACWI historical corrections
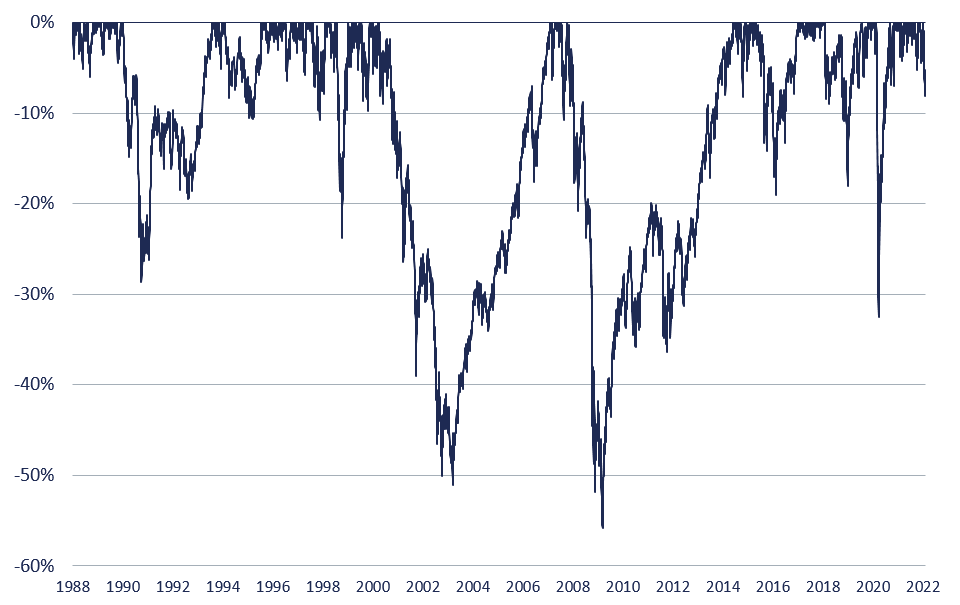
Sources: DGAM, Refinitiv, January 31, 2022
Looking at the relationship between interest rates and 12-month forward P/E multiples, if yields continue their upward trend as global central banks begin the process of shrinking their balance sheets, the likelihood of additional declines in equity markets is not negligeable, especially for the more expensive US equities.
Has liquidity boosted valuations or was it just the economy?
G7 central banks purchases and MSCI World P/E forward ratio
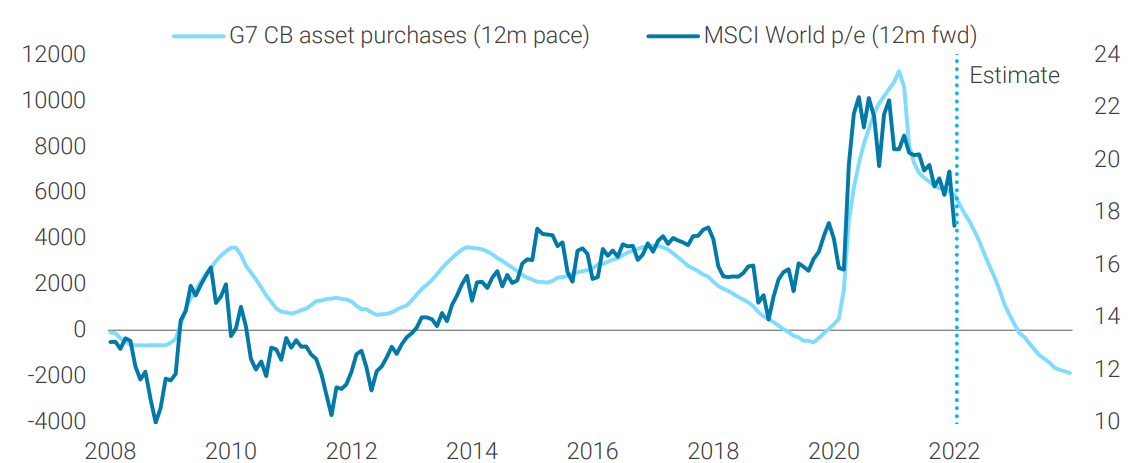
Sources: Bloomberg, TS Lombard, January 28, 2022
Initial concerns regarding the removal of extremely accommodative monetary conditions weighed heavily on the largest stocks but the underperformance was largely erased in the final days of January despite the Federal Open Market Committee (FOMC) sticking to its game plan and analysts increasing their expectations for rate hikes this year. Some investors jumped back in the market following the sharp decline in prices. The net long positions in the S&P 500 e-mini contracts jumped to the highest since late 2018.
US Mega-cap stocks lost some of their appeal in January
S&P 500 equal weight index / market weight index
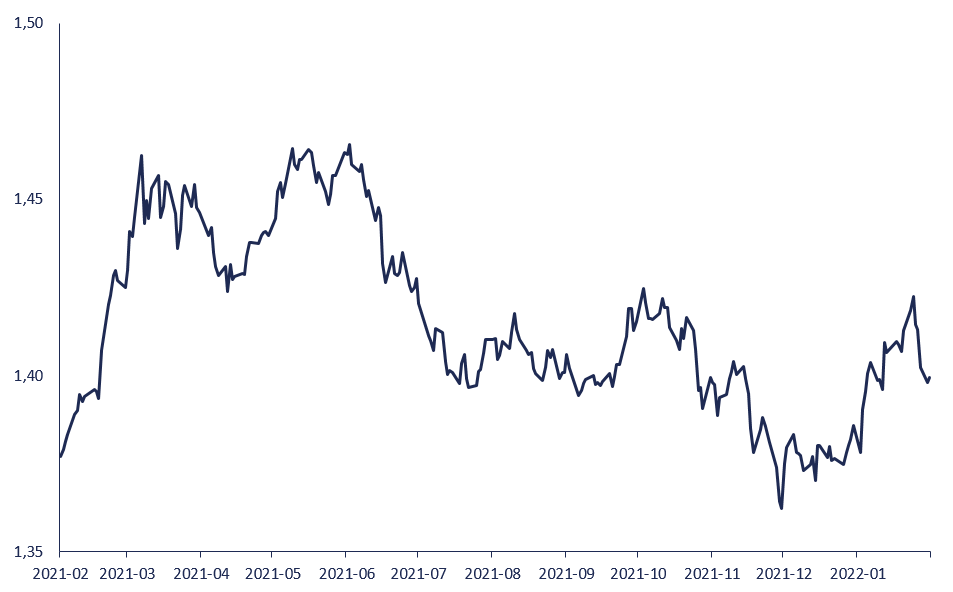
Sources: DGAM, Bloomberg, as of January 31, 2022
Investors are going long equities after pullback
Bloomberg CFTC E-mini S&P 500 net non-commercial futures positions
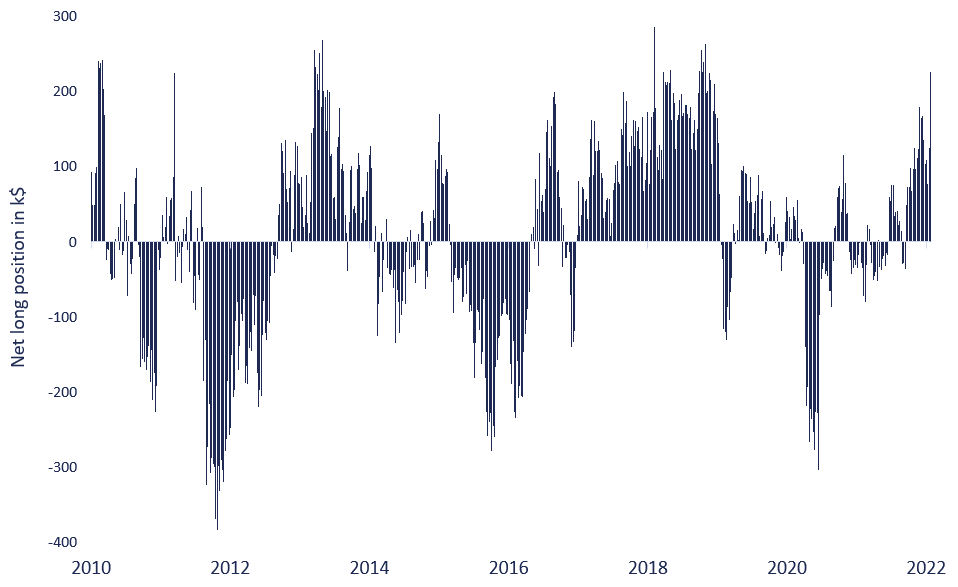
Sources: DGAM, Bloomberg, January 31, 2022
On the macro front, the economic indicators point to slower growth as the omicron variant took a toll on activity over the last couple of months. We are now on the tail-end of this wave of infections, but it does look like US real GDP growth will be weak to start the year.
The likelihood of a negative growth surprise is increasing with the latest publication of the Federal Reserve Bank of Atlanta’s GDPNow forecast estimate which stands at a paltry 0.1%1. This is significantly below the latest Blue Chip consensus forecast of more than 3%. At the same time, the uncertainty at the corporate level was confirmed in the first two weeks of earnings season with the corporate guidance ratio falling to its lowest level since February 2020.
Evolution of Atlanta Fed GDPNow real GDP estimate for 2022 Q1
Quarterly percent change (SAAR)
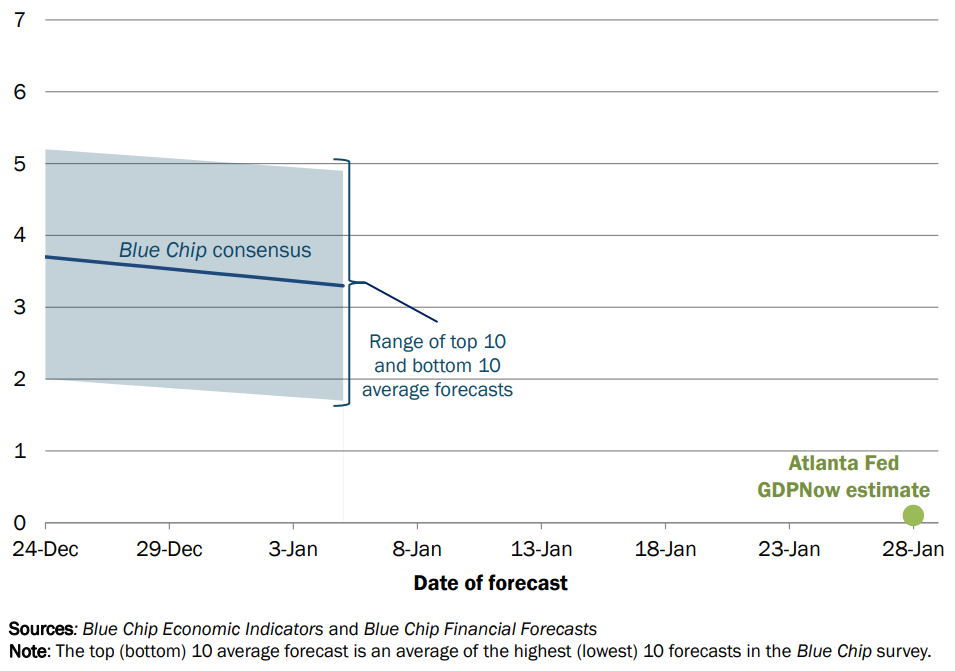
Sources: Federal Reserve Bank of Atlanta, January 28, 2022
S&P 500 corporate guidance ratio
Number above vs below consensus
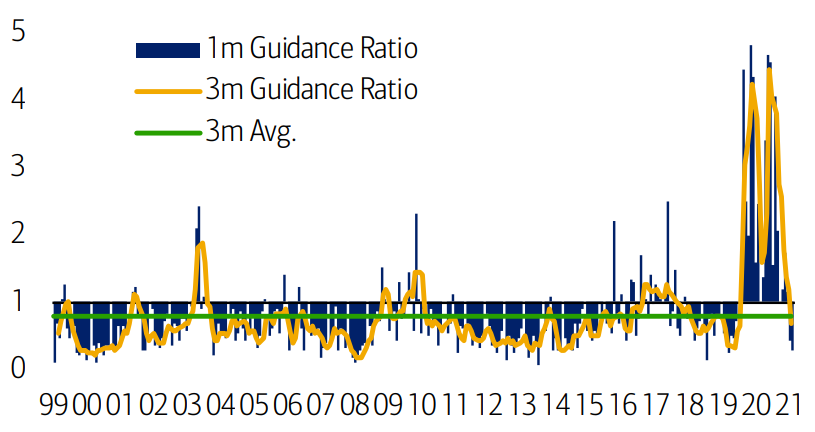
Source: BofA US Equity and Quantitative Strategy2
After several years of low inflation, the recent rise in prices to a level last observed more than 30 years ago is also weighing on consumers’ enthusiasm. The University of Michigan confidence survey index has fallen to its lowest level since the sovereign debt crisis.
University of Michigan consumer sentiment Index
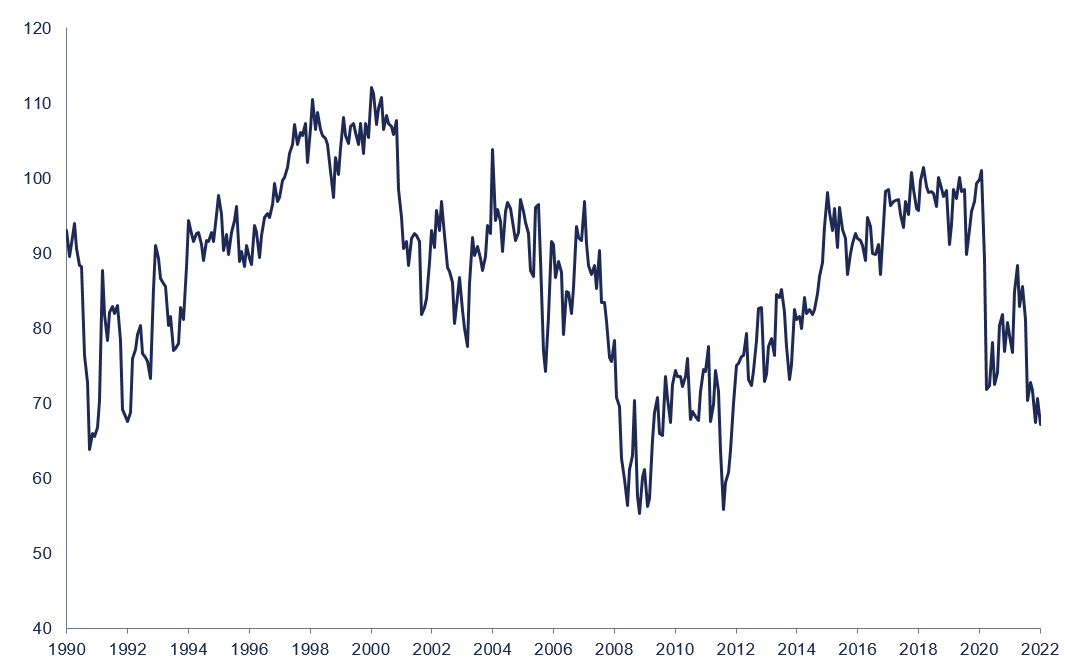
Sources: DGAM, Bloomberg, as of January 31, 2022
A slowdown in economic activity combined with a long list of headwinds such as rising interest rates, higher wages and inflation, increases the probability that earnings growth expectations are revised lower in the coming months. Lower earnings and lower valuation multiples are not a good combination for equity markets.
If the US Federal Reserve (Fed) is serious about fighting inflation, the pain threshold in equity markets before the Fed scales back its commitment is likely much higher today compared to just a couple years ago. The Fed’s dual mandate does not include supporting equity prices. With inflation sitting at a 40-year high and the unemployment rate just above 4%, it would be difficult for FOMC members to argue against at least some tightening of monetary conditions. Granted the Fed would react if a decline in equity prices was large enough to negatively impact the economic outlook but after a 265% gain over the last 10 years, the most recent 8% pullback could be considered chump change.
While the Fed is going down the road of tighter monetary conditions, the Chinese government has implemented several targeted easing measures in recent weeks. These measures should help stabilize economic activity which will likely be a welcomed development for investors that ditched Chinese equities over the last couple of years.
MSCI China vs MSCI World 12-month excess returns
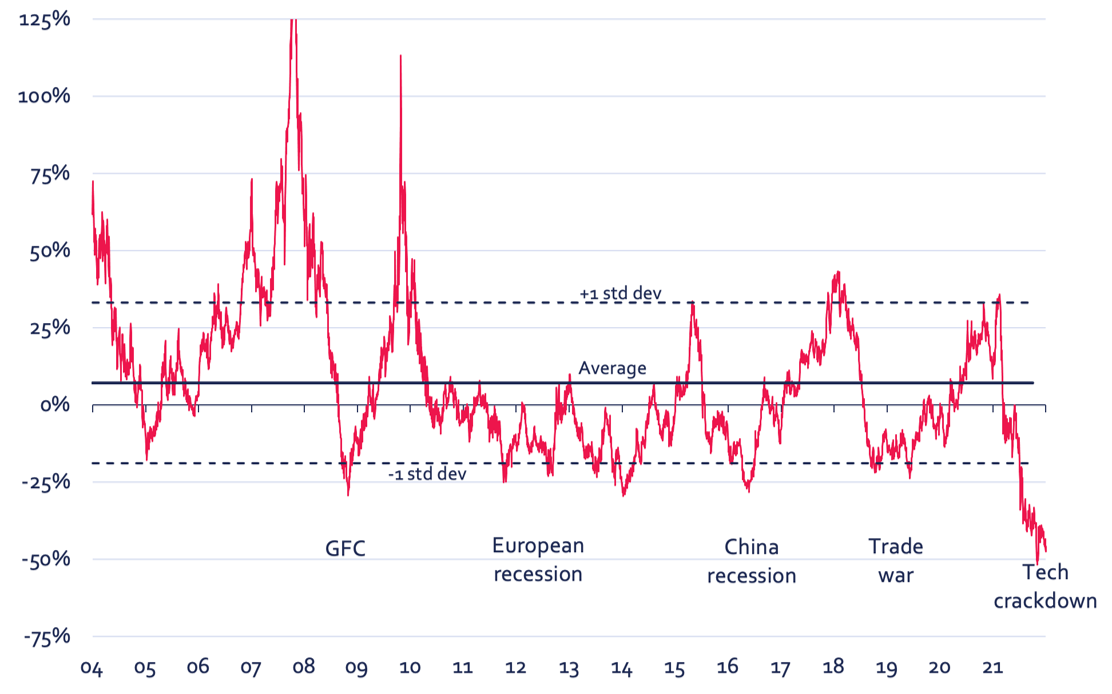
Sources: DGAM, MSCI, Refinitiv, December 31, 2021
The anxiety exhibited by equity investors is showing up in some segments of credit markets, but the stress remains contained as sub-investment grade debt yield remains low by historical standards. The housing sector could also suffer from higher rates amid tighter monetary conditions. The Fed was an important buyer of mortgage-backed securities over the last 18 months and the reduced pace of purchases over the last few months has been driving mortgage rates higher. We are closely monitoring these markets as they could provide early indications of a deterioration in the global economy’s and financial markets’ health.
Sub-investment grade bond yield
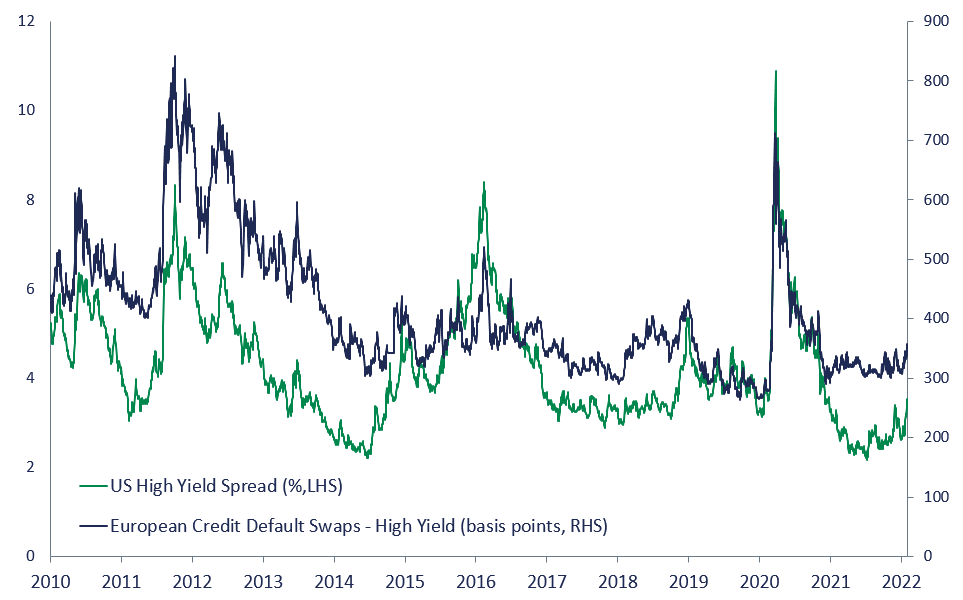
Sources: DGAM, Bloomberg, as of January 31, 2022
As we make our way through another wave of COVID, we are learning to live with the virus and many governments are doing away with restrictions despite a high rate of infections3. We can celebrate a return to a life with less restrictions but that also means the end of extraordinary stimulus, both monetary and fiscal. Going back to pre-COVID life could also mean lower demand given the trend that prevailed before the initial lockdowns in March 2020.
Global earnings were trading lower before COVID-19
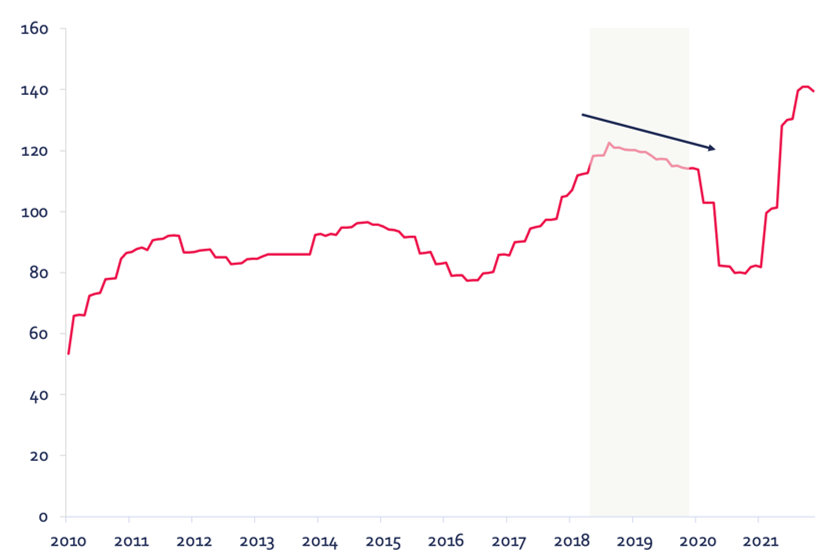
Sources: DGAM, Bloomberg, January 16, 2022
Market performance
MSCI ACWI region performance
Total returns for 1M, 3M and 1Y as of January 31, 2022
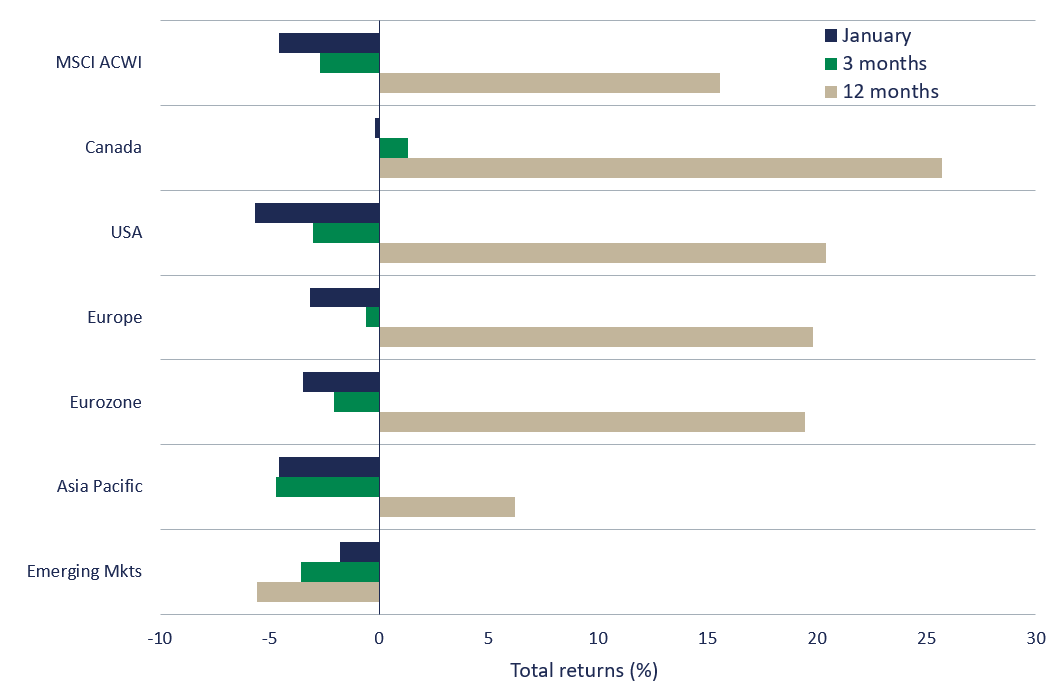
Sources: DGAM, Refinitiv, January 31, 2022
MSCI ACWI sector performance
Total returns for 1M, 3M and 1Y as of January 31, 2022
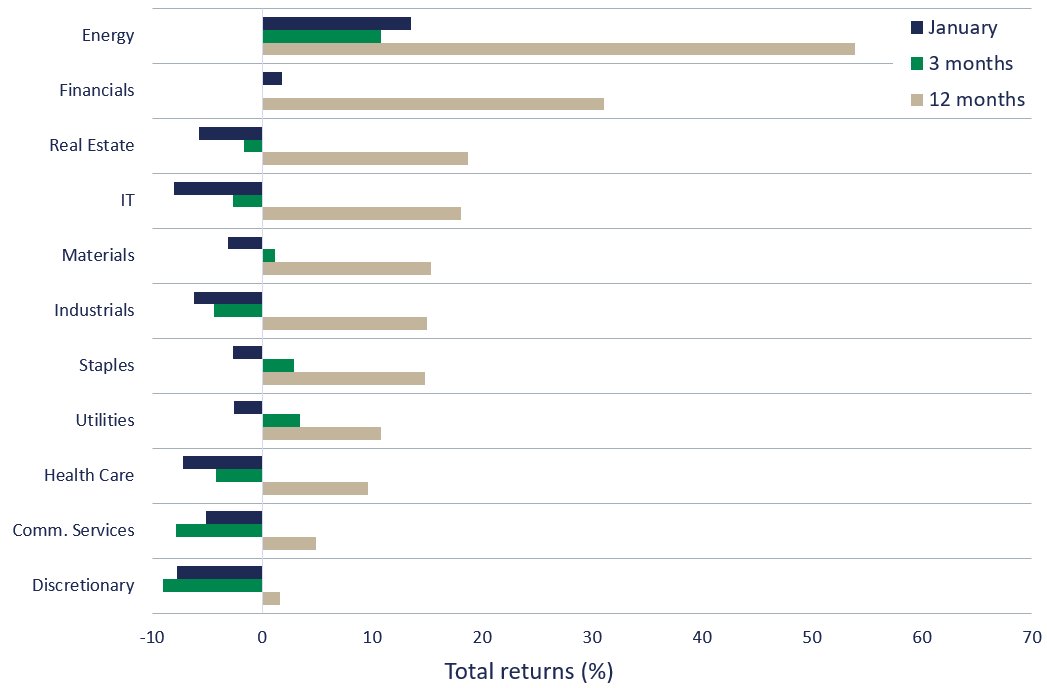
Sources: DGAM, Refinitiv, January 31, 2022
Conclusion
With the US Federal Reserve seemingly staying on course to increase interest rates in March and begin shrinking its balance sheet sometime in the back half of the year, the upward pressure on treasury yields is likely to remain. This suggests that multiple contraction should continue while clouds gather over the macro-economic backdrop.
We welcome any questions or comments you may have. We can be reached at service@hexavest.com
- Federal Reserve Bank of Atlanta: Atlanta Fed GDPNow Estimate for 2022: Q1, January 28, 2022
- Bank of America Global Research: Earnings Tracker, Week 3: January guidance ratio back at COVID lows, January 25, 2022
- Denmark scraps most COVID-19 restrictions, CTV News, February 1, 2022 https://www.ctvnews.ca/health/coronavirus/denmark-scraps-most-covid-19-restrictions-1.5762498
Important Information and Disclosure
Source of all data and information: DGAM and MSCI as at January 31, 2022, unless otherwise specified.
This material is presented for information and illustrative purposes only. The opinions expressed in this document represent the current, good-faith views of DGAM at the time of publication and are provided for limited purposes, are not definitive investment advice, and should not be relied on as such. The information presented herein has been developed internally and/or obtained from sources believed to be reliable; however, DGAM does not guarantee the accuracy, adequacy, or completeness of such information. Predictions, opinions, and other information contained herein are subject to change continually and without notice and may no longer be true after the date indicated. DGAM disclaims responsibility for updating such views, analyses or other information. Different views may be expressed based on different investment styles, objectives, opinions or philosophies.
All references to the “Hexavest ACWI equity portfolio”, to the “ACWI Equity representative portfolio”, to the “portfolio”, or to their performance in this document refer to an actual portfolio managed by DGAM which is used to objectively represent the firm’s Global ACWI Equity strategy. The performance of this representative portfolio has been included in Hexavest’s ACWI Composite (Composite) since its inception in 2014. The Composite includes portfolios that invest primarily in equities of companies located in the developed markets and emerging markets of Americas, Europe & Middle East, and Asia Pacific. DGAM uses an investment approach that is predominantly “top-down” to construct diversified portfolios that typically contain more than 275 stocks. Asset allocation between regions, countries, currencies, and sectors can deviate substantially from that of the benchmark. Some portfolios may invest a small portion of their assets in countries and currencies not included in the benchmark. A client’s actual holdings, performance and investment experience will be different from that shown.
Gross-of-fee performance results are presented before management and custodial fees but after all trading commissions and withholding taxes on dividends, interest, and capital gains, when applicable. Such fees and expenses would reduce the results shown. Fee levels may vary from client to client depending on the portfolio size and the ability of the client to negotiate fees.
The MSCI ACWI Index is a broad-based securities market index and used for illustrative purposes only. The MSCI ACWI Index is a free float-adjusted market capitalization weighted index that is designed to measure the equity market performance of developed and emerging markets. Performance for the MSCI ACWI Index is shown “net”, which includes dividend reinvestments after deduction of foreign withholding tax. Broad-based securities indices are unmanaged and are not subject to fees and expenses typically associated with managed accounts or investment It is not possible to invest directly in an index. MSCI data may not be reproduced or used for any other purpose. MSCI provides no warranties, has not prepared or approved this document, and has no liability hereunder.
Past performance does not predict future results. This material may contain statements that are not historical facts (i.e., forward-looking statements). Any forward-looking statements speak only as of the date they are made, and DGAM assumes no duty to and does not undertake to update forward-looking statements. Forward-looking statements are subject to numerous assumptions, risks, and uncertainties, which change over time. Future results may differ significantly from those stated in forward-looking statements, depending on factors such as changes in securities or financial markets or general economic conditions. Not all DGAM’s recommendations have been or will be profitable. Investing entails risks and there can be no assurance that DGAM will achieve profits or avoid incurring losses. It should not be assumed that any investor will have an investment experience similar to returns shown.
This material is for the benefit of persons whom DGAM reasonably believes it is permitted to communicate to and should not be reproduced, distributed or forwarded to any other person without the written consent of DGAM.