February: The better outlook brought on higher risks
March 12, 2021
The narrative driving equity markets’ performance in February was one of better than feared economic data, a sharp decline in the number of new COVID-19 infections globally, a rapid improvement in the pace of vaccination in some countries and increasing expectations that the next round of U.S. economic stimulus will be larger than initially anticipated.
Bolstered by US$600 stimulus checks per person and renewed unemployment support programs, U.S. retail sales jumped 6% year-over-year in January. In addition, around the world, the manufacturing sector is holding up better than feared and compensating for weakness in the service industries.
Because of a tough comparison base, analysts expect weak economic data in the first couple months of 2021 with investors ignoring the weakness and focusing instead on the prospects of stronger growth later this year. The consensus sees the global economy accelerating in the coming months as vaccination campaigns accelerate which could allow governments to loosen social distancing measures. In addition, the stimulus plan put forward by the Biden administration would put over US$12,000 in the pockets of a family of four with a household income of less than US$150,000. This could lead to a jump in demand at the same time as the economy is re-opening.
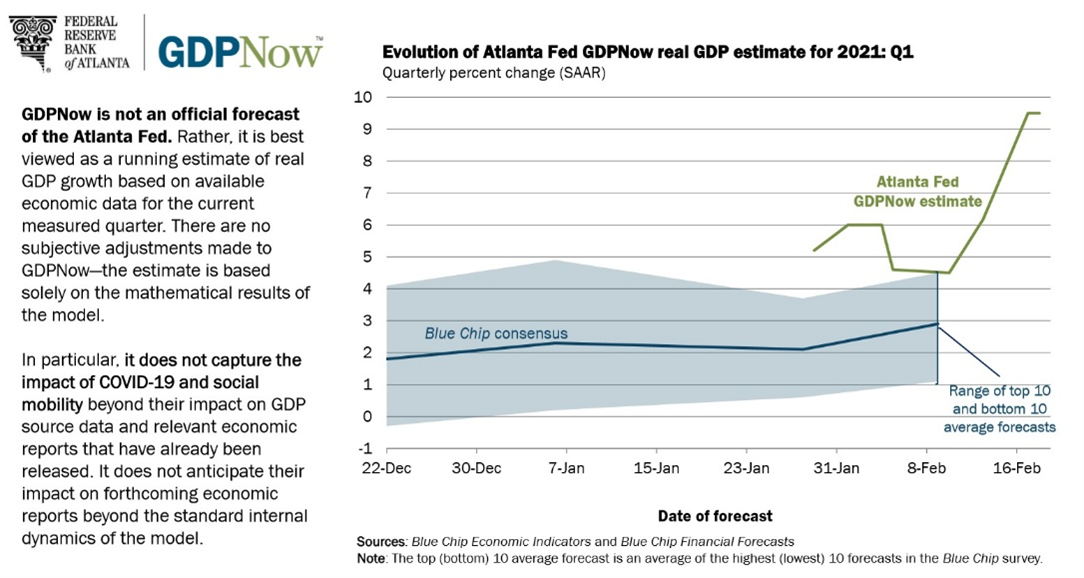
The improvement in the data over the last few weeks is also driving a move upwards in growth expectations. The Atlanta Fed GDP estimates (GDPNowTM) for the first quarter are now well above the consensus forecasts.
Stronger growth expectations combined with a weaker greenback, government spending and excess liquidity is driving commodity prices much higher. Also, key government policies that incentivize “green” investments are driving speculation that demand will spike for all the commodities involved in the value-chain from smart-grid to electric vehicles and hydrogen. The GCSI commodity index is up 11% in February and 16% year-to-date. Copper, at US$4.10 per pound, is now the most expensive since 2011. At the same time, a jump in real rates weighed on the price of gold last month to its lowest level since June 2020 at US$1,733 per ounce.
All these developments have led to a sharp repricing of inflation expectations. The University of Michigan 1-year inflation expectation index sits at its highest since 2014, the ISM manufacturing price paid index rose the most going back to 2011 while some food producers noted they were starting to feel the pressure from rising input prices with Reuters reporting the companies will have to pass the cost on to the consumers sooner rather than later.
As a result, we experienced a sharp repricing of bond yields with the US 10-year at 1.51% on the second to last day of February. While the absolute level remains low in the historical context, the increase from the low of 0.5% back in August 2020 is significant and greater than what has been observed in previous episodes of taper tantrum. At the same time, a steady hand and clear message from the Federal Reserve (Fed) has anchored short-term interest rates, resulting in a sharp steepening of the yield curve.
Both the Fed and Treasury Secretary Yellen have reiterated on multiple occasions their message that the risks of doing too little are bigger than inflation risks. Hence, we believe that a change of course in monetary policy seems unlikely at this time. How much will the Fed be willing or able to fight the pickup in inflation expectations remains to be seen, but a slightly less dovish tone could spell trouble for expensive equity markets.
While the outlook has improved in recent weeks amid improving vaccination trends and the potential for a larger fiscal stimulus in the U.S., investors aren’t heeding the potential risks to re-opening the economies such as new variants of the COVID-19 virus with some studies suggesting the current vaccines may not be as effective. If these variants become the predominant source of infections, pharmaceutical companies will be forced back into the lab to “tweak” the formula and this could delay the recovery later into 2021.
Market performance
The MSCI World index gained 2.6% in local currencies in February, posting positive returns for 12 consecutive positive days, a long sequence we rarely see. Meanwhile, the MSCI ACWI index (+2.4%) trailed slightly behind as Emerging markets were hit hard during the last days of the month.
Improving growth expectations and rising yields fueled the reflation trade with economically sensitive sectors moving up sharply. Energy (+13.0%) was the best performing sector as crude oil jumped 18%, followed by financials (+8.8%) and communication services (+5.3%) with the latter helped by a strong earnings report by Google in the first week of the month. At the same time, defensive sectors continued to underperform with utilities, health care and staples declining 5.1%, 2.6% and 2.5% respectively.
A stronger demand backdrop for chips coming out of the COVID-19 crisis has led to a chip shortage propelling the semiconductor industry higher by 11% year-to-date, making it one of the best performing industry over a 12-month period with a gain of 70%.
Rising interest rates led investors to adjust price targets for long-duration assets like utilities and richly valued technology companies. A higher discount rate means the value of a stream of future revenues is lower and therefore valuation multiples come under pressure.
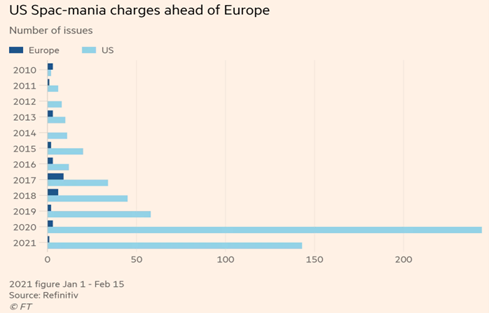
While the fervor from retail investors may have subsided this month, there remains many pockets of euphoria to suggest investor sentiment remains stretched. One such example is SPACs (Special Purpose Acquisition Companies) which have garnered a large interest in recent quarters and have continued to do so in 2021. As you can see in the table below, in 2020 alone, more money has been raised than in all the previous years combined. In the first six weeks of 2021, funds are already more than half those raised in 2020. Excess liquidity and low interest rates are driving investors to find alternative investments: in order to boost returns. Investors seem to be willing to take a big gamble by handing over their money to a blank cheque company.
Conclusion
The prospect of a return to normal growth once the pandemic subsides has led to a ‘reflation trade’ in which interest rates have risen significantly. The market’s reaction during the latter part of February is a reminder of the euphoria in the marketplace and the risky backdrop that was built on the shaky foundation of searching for higher returns and rising debt levels. Our disciplined investment process keeps signaling a prudent approach amidst the prevalent disregard for fundamentals. Therefore, we are maintaining our cautious stance and defensive positioning.
Important Information and Disclosure
Source of all data and information: Hexavest and MSCI as at February 28, 2021, unless otherwise specified.
This material is presented for information and illustrative purposes only. The opinions expressed in this document represent the current, good-faith views of Hexavest at the time of publication and are provided for limited purposes, are not definitive investment advice, and should not be relied on as such. The information presented herein has been developed internally and/or obtained from sources believed to be reliable; however, Hexavest does not guarantee the accuracy, adequacy, or completeness of such information. Predictions, opinions, and other information contained herein are subject to change continually and without notice and may no longer be true after the date indicated. Hexavest disclaims responsibility for updating such views, analyses or other information. Different views may be expressed based on different investment styles, objectives, opinions or philosophies.
All references to the “Hexavest ACWI equity portfolio”, to the “ACWI Equity representative portfolio”, to the “portfolio”, or to their performance in this document refer to an actual portfolio managed by Hexavest which is used to objectively represent the firm’s Global ACWI Equity strategy. The performance of this representative portfolio has been included in Hexavest’s ACWI Composite (Composite) since its inception in 2014. The Composite includes portfolios that invest primarily in equities of companies located in the developed markets and emerging markets of Americas, Europe & Middle East and Asia Pacific. Hexavest uses an investment approach that is predominantly “top-down” to construct diversified portfolios that typically contain more than 275 stocks. Asset allocation between regions, countries, currencies, and sectors can deviate substantially from that of the benchmark. Some portfolios may invest a small portion of their assets in countries and currencies not included in the benchmark. A client’s actual holdings, performance and investment experience will be different from that shown.
Gross-of-fee performance results are presented before management and custodial fees but after all trading commissions and withholding taxes on dividends, interest and capital gains, when applicable. Such fees and expenses would reduce the results shown. Fee levels may vary from client to client depending on the portfolio size and the ability of the client to negotiate fees.
The MSCI ACWI Index is a broad-based securities market index and used for illustrative purposes only. The MSCI ACWI Index is a free float-adjusted market capitalization weighted index that is designed to measure the equity market performance of developed and emerging markets. Performance for the MSCI ACWI Index is shown “net”, which includes dividend reinvestments after deduction of foreign withholding tax. Broad-based securities indices are unmanaged and are not subject to fees and expenses typically associated with managed accounts or investment It is not possible to invest directly in an index. MSCI data may not be reproduced or used for any other purpose. MSCI provides no warranties, has not prepared or approved this document, and has no liability hereunder.
Past performance does not predict future results. This material may contain statements that are not historical facts (i.e., forward-looking statements). Any forward-looking statements speak only as of the date they are made, and Hexavest assumes no duty to and does not undertake to update forward-looking statements. Forward-looking statements are subject to numerous assumptions, risks, and uncertainties, which change over time. Future results may differ significantly from those stated in forward-looking statements, depending on factors such as changes in securities or financial markets or general economic conditions. Not all Hexavest’s recommendations have been or will be profitable. Investing entails risks and there can be no assurance that Hexavest will achieve profits or avoid incurring losses. It should not be assumed that any investor will have an investment experience similar to returns shown.
This material is for the benefit of persons whom Hexavest reasonably believes it is permitted to communicate to and should not be reproduced, distributed or forwarded to any other person without the written consent of Hexavest.